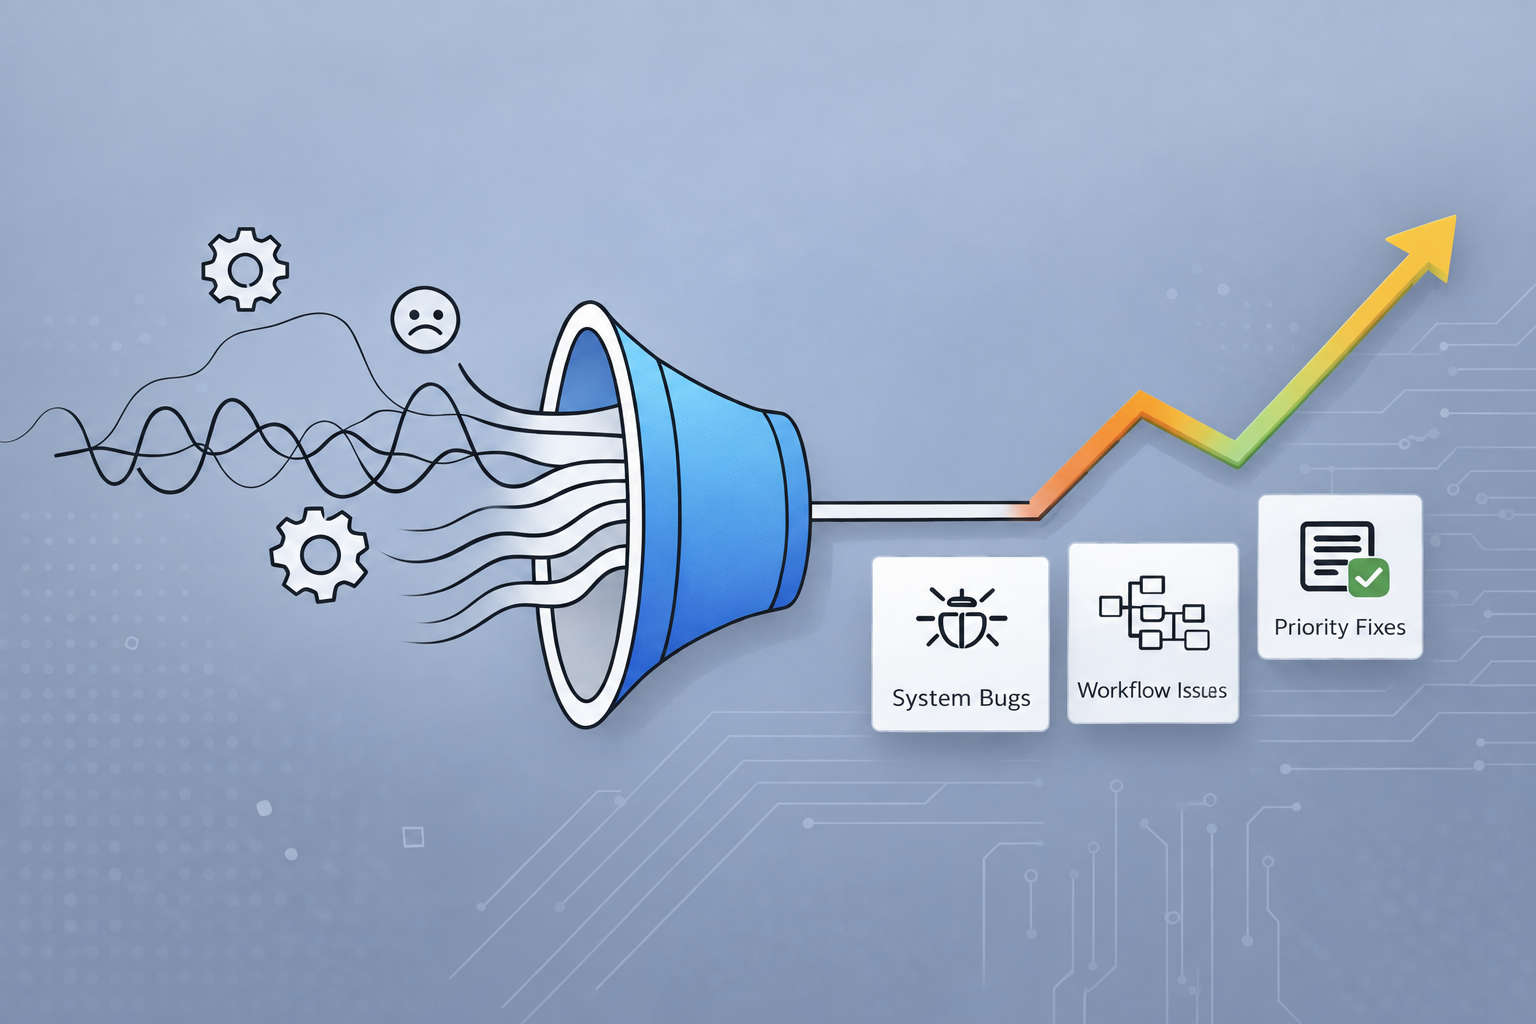
The question
Which experience problems should the team act on first?
Harmony supported enterprise governance workflows across multiple user roles. A recurring platform-health survey created an opportunity to connect satisfaction and effort measures with existing feedback from support channels, in-app comments, and interviews. I designed, deployed, analyzed, and presented the study within two weeks.
My approach
How I worked through it.
Define the audience precisely
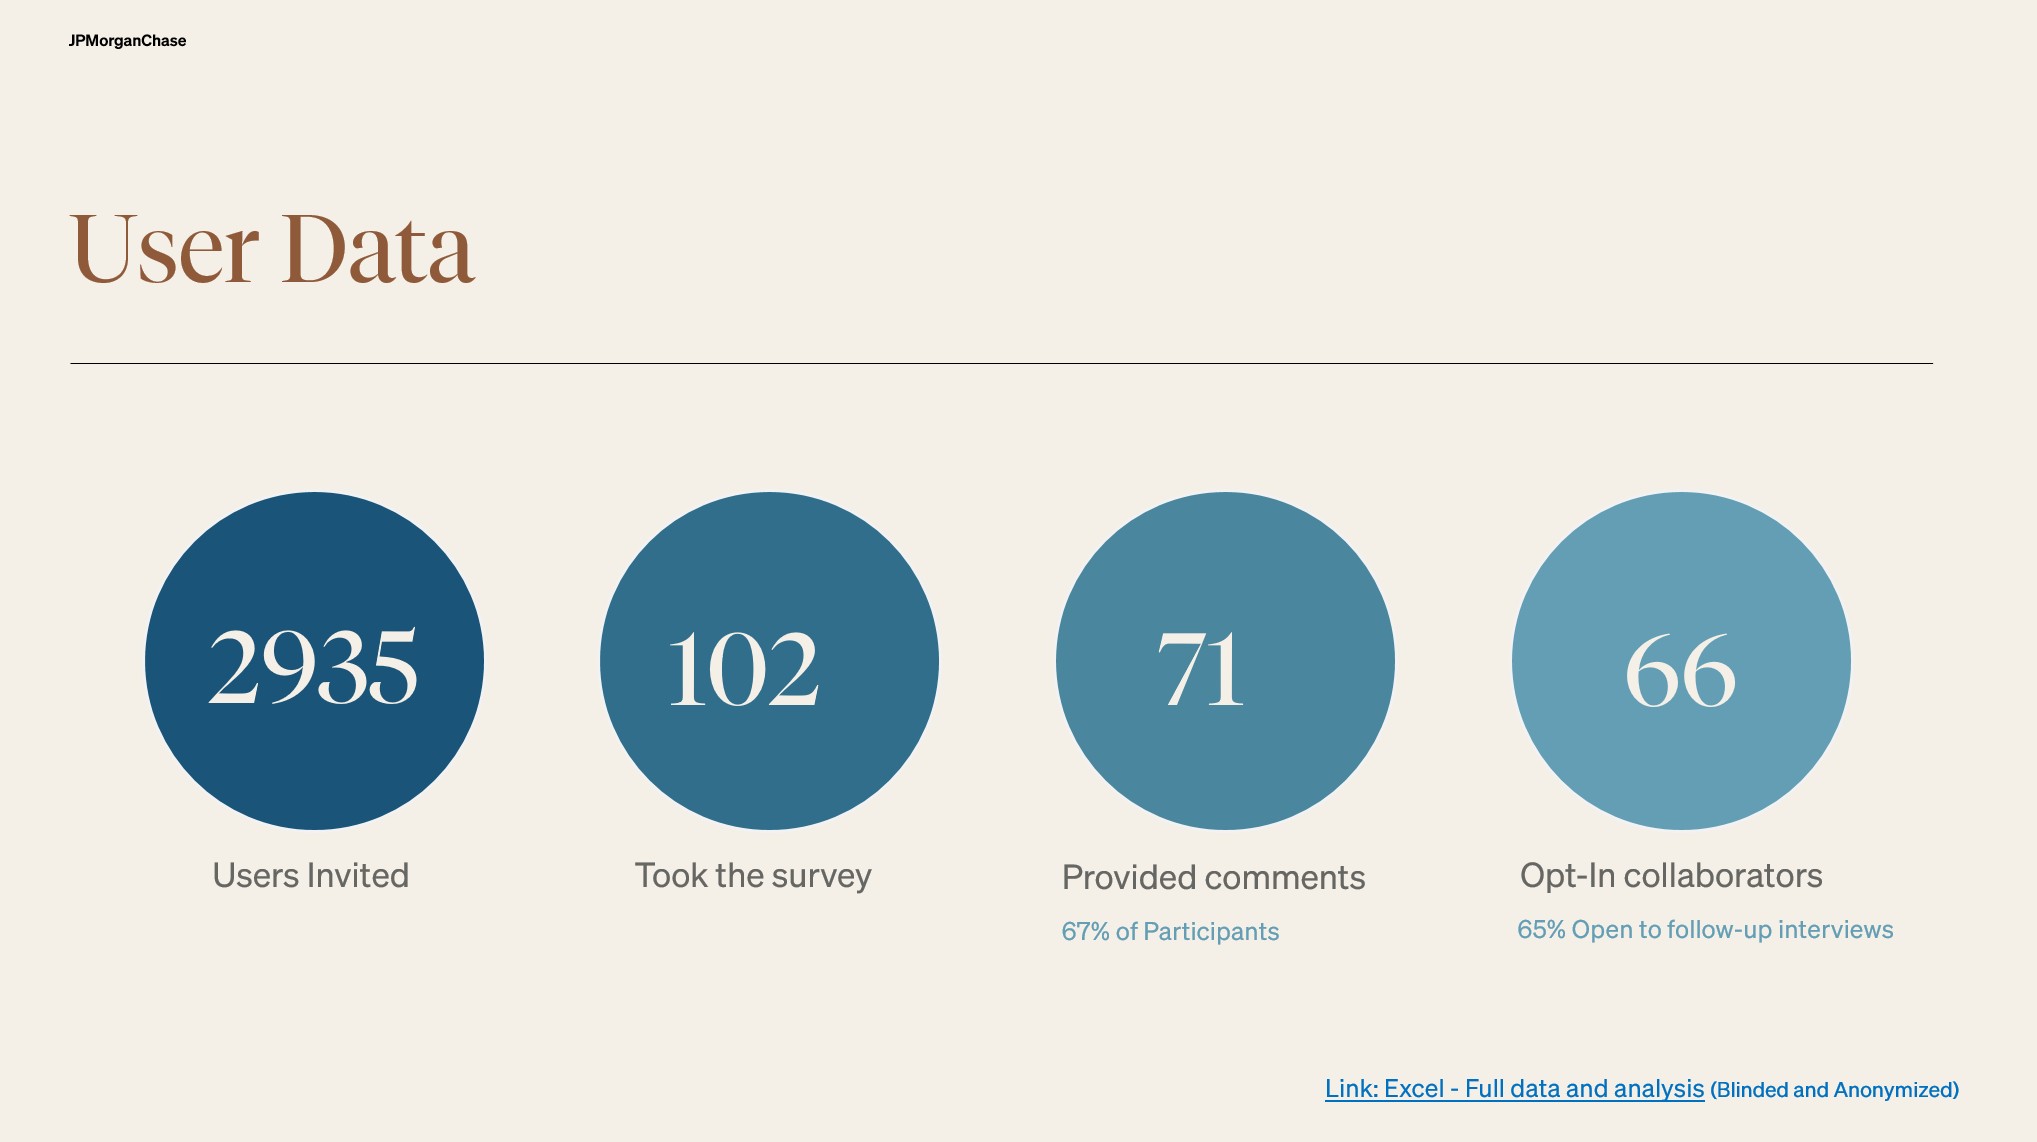
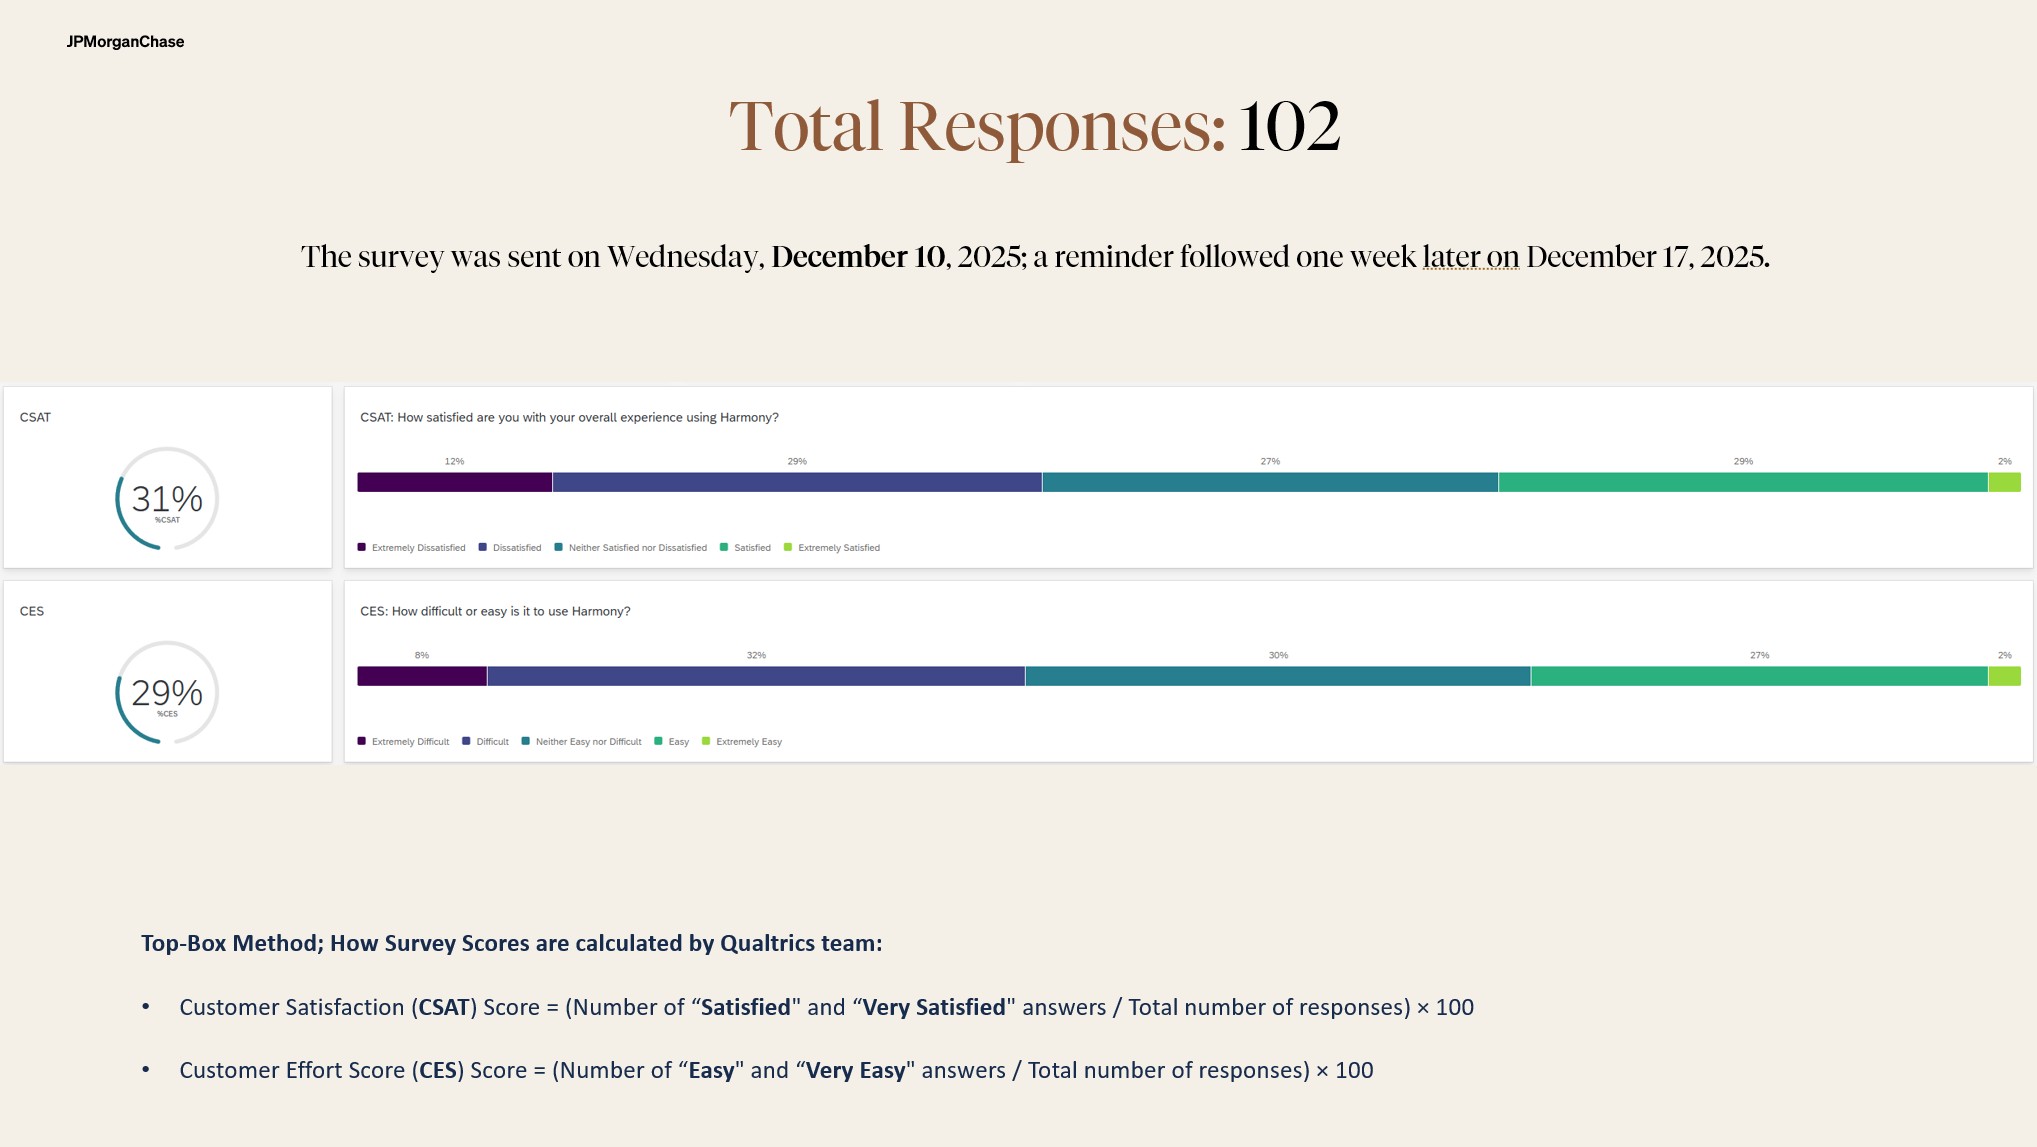
Partnering with data and product teams produced an invitation list of 2,935 active users and a survey spanning six primary personas. One hundred and two people responded.
Segment without losing the sample context
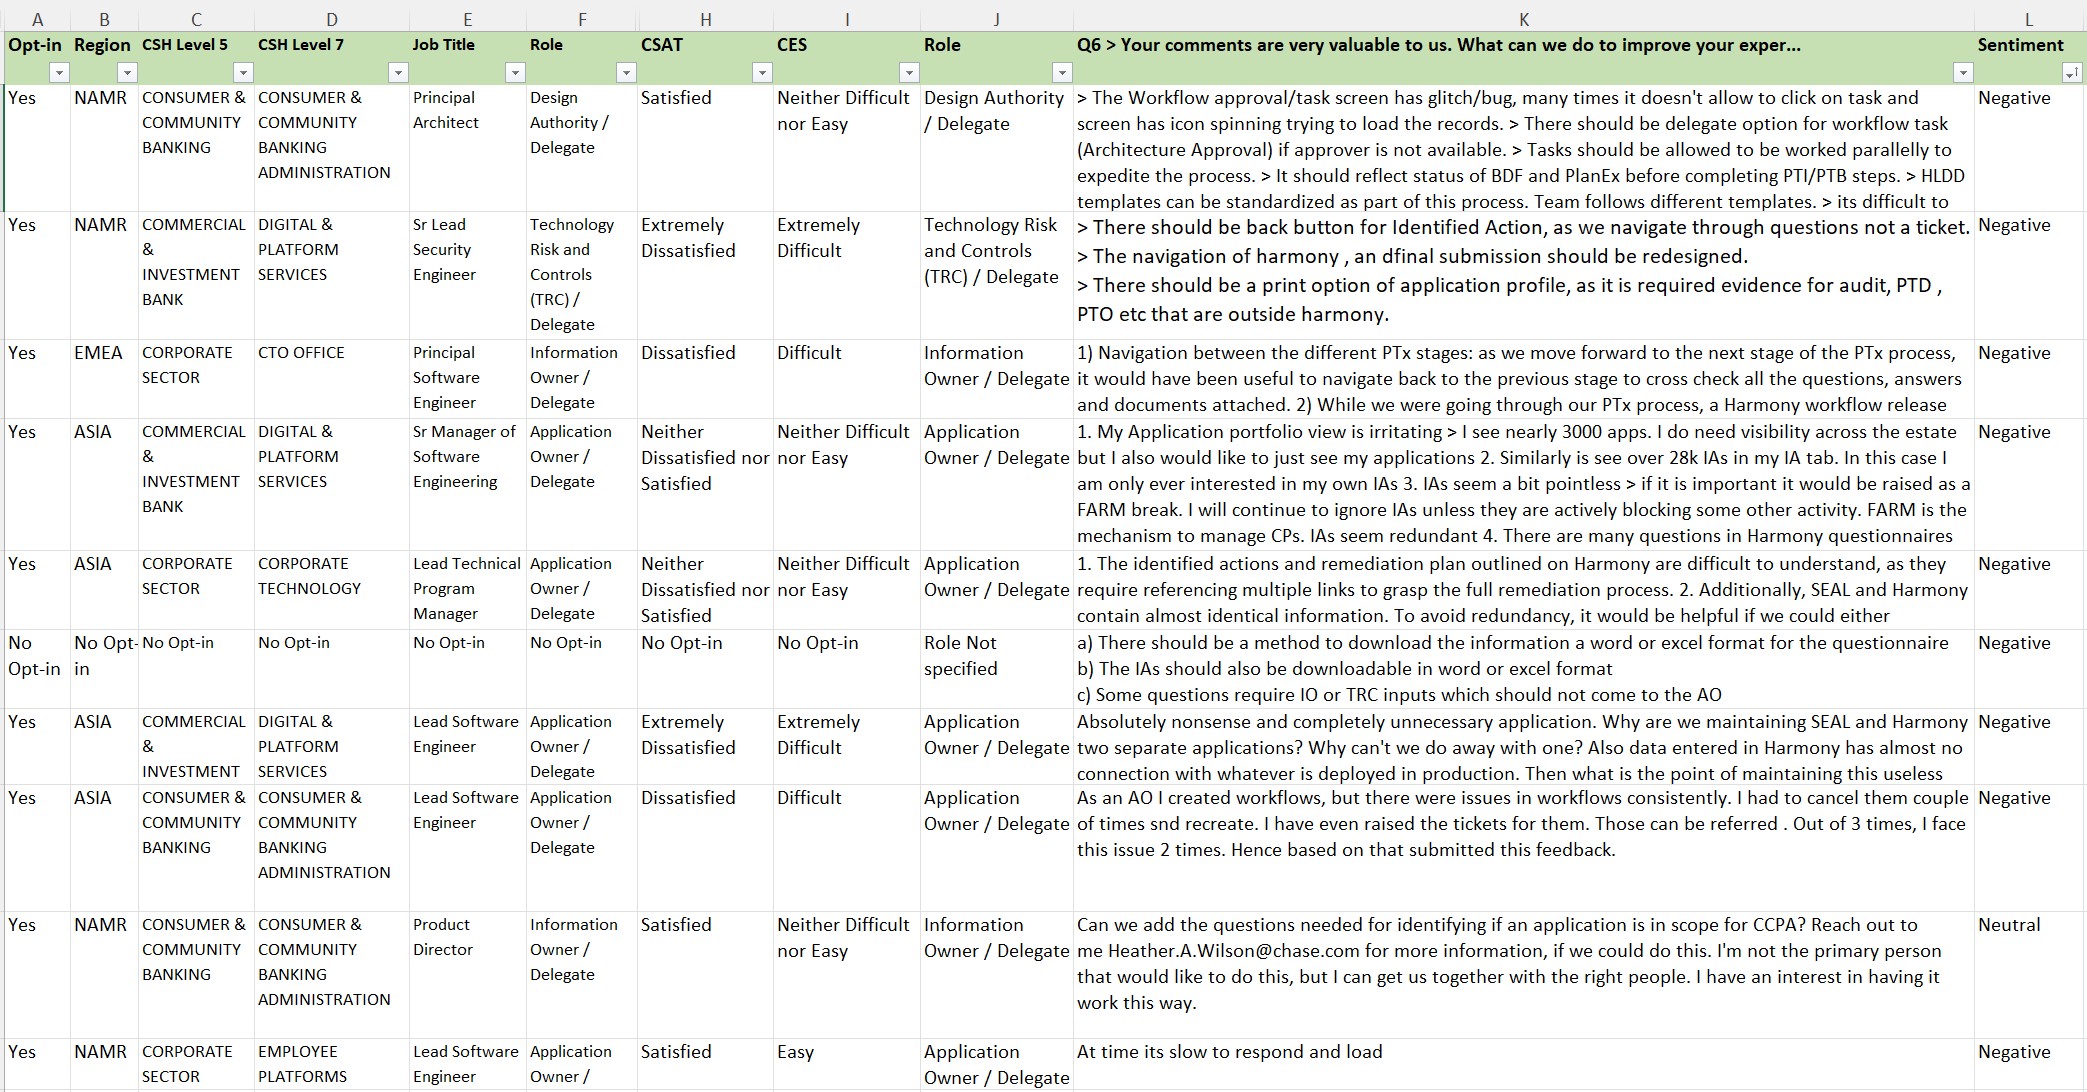
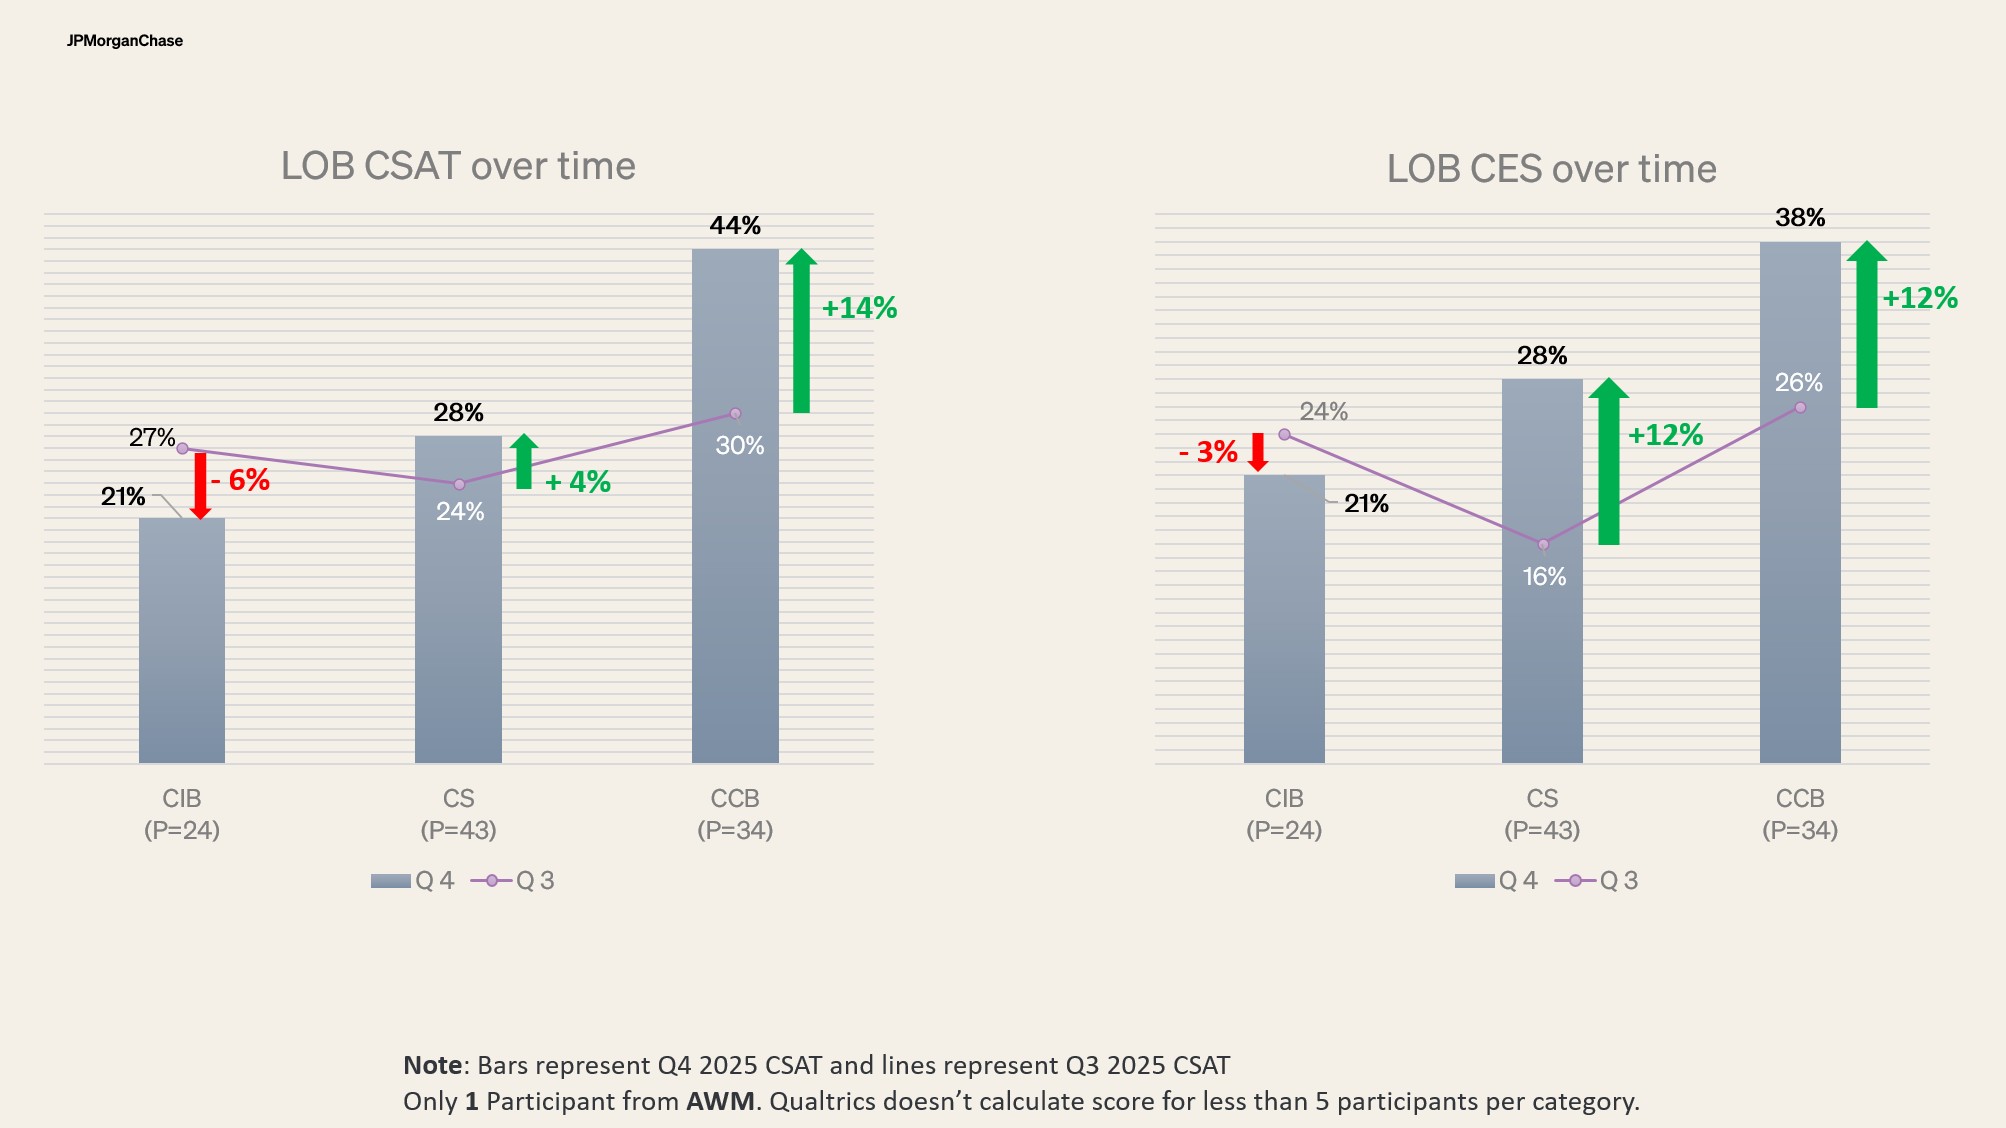
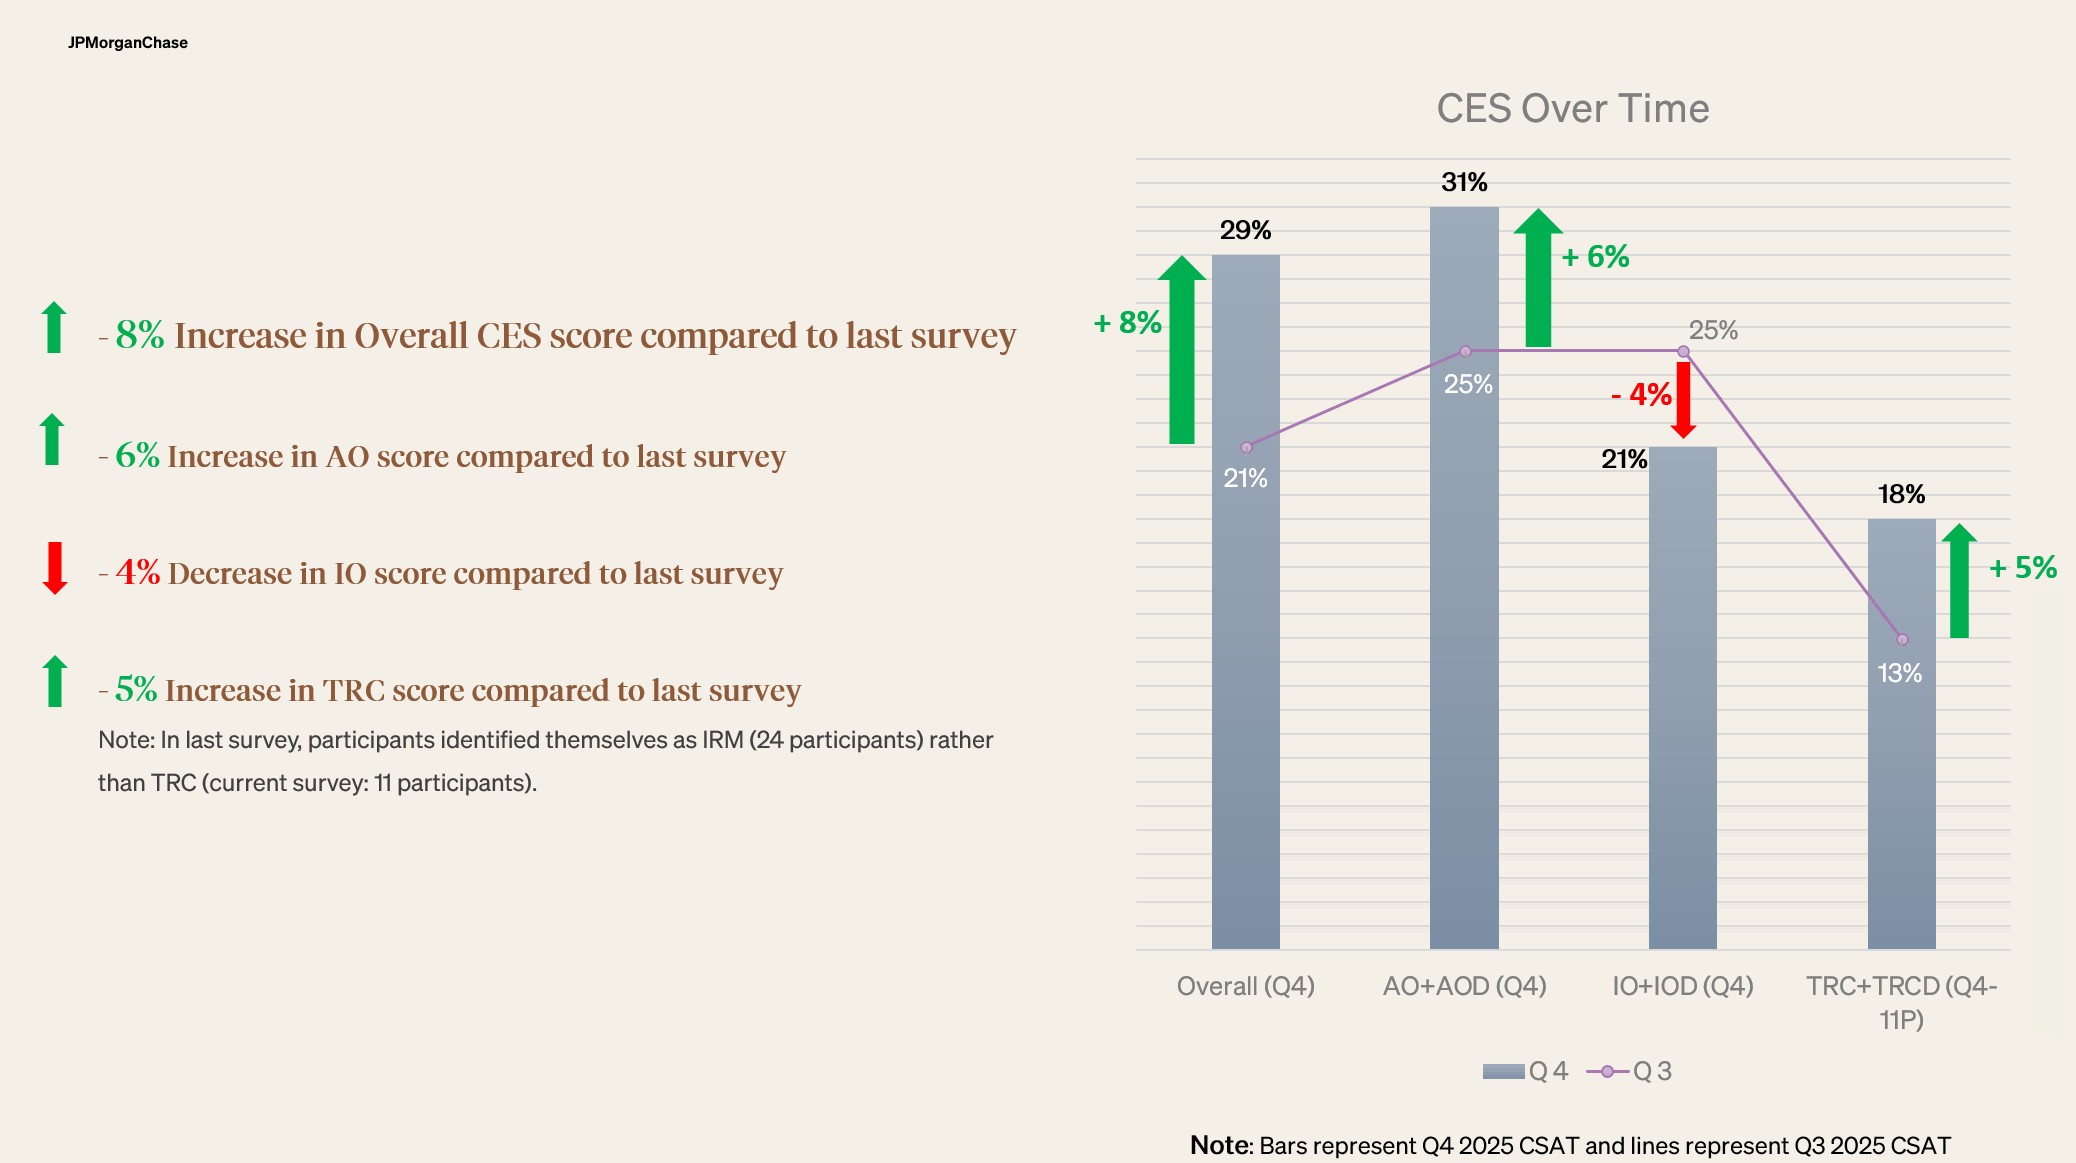
I reviewed satisfaction and effort by role and business area, then analyzed open-text responses. Around two-thirds of respondents provided qualitative feedback, creating useful leads for deeper inquiry.
Connect findings to engineering’s priorities
I compared survey themes with earlier support and research evidence, then facilitated prioritization around reliability, data loss, workflow control, and audit needs.
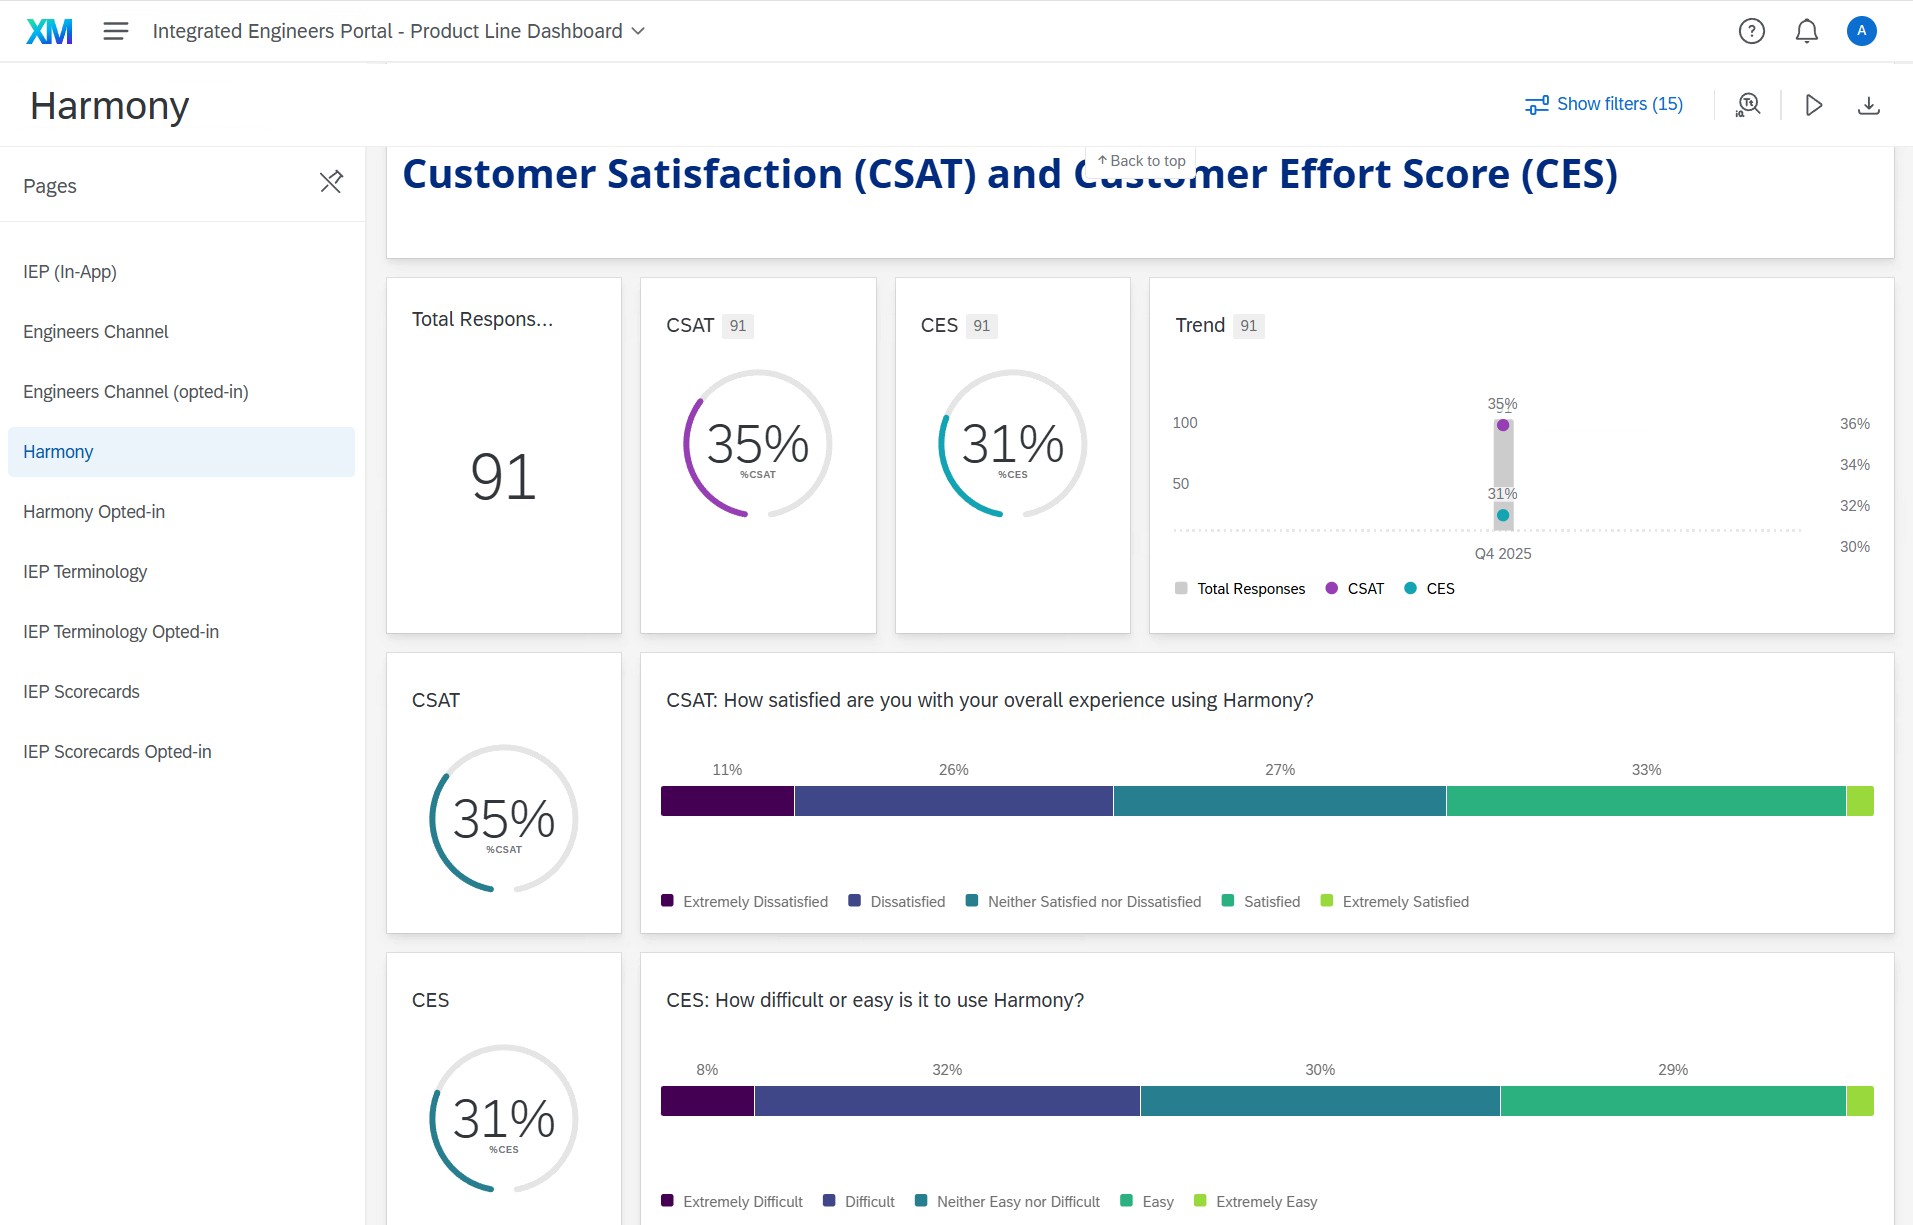
The sample behind the score
Evidence to decisions
What mattered. What it changed.
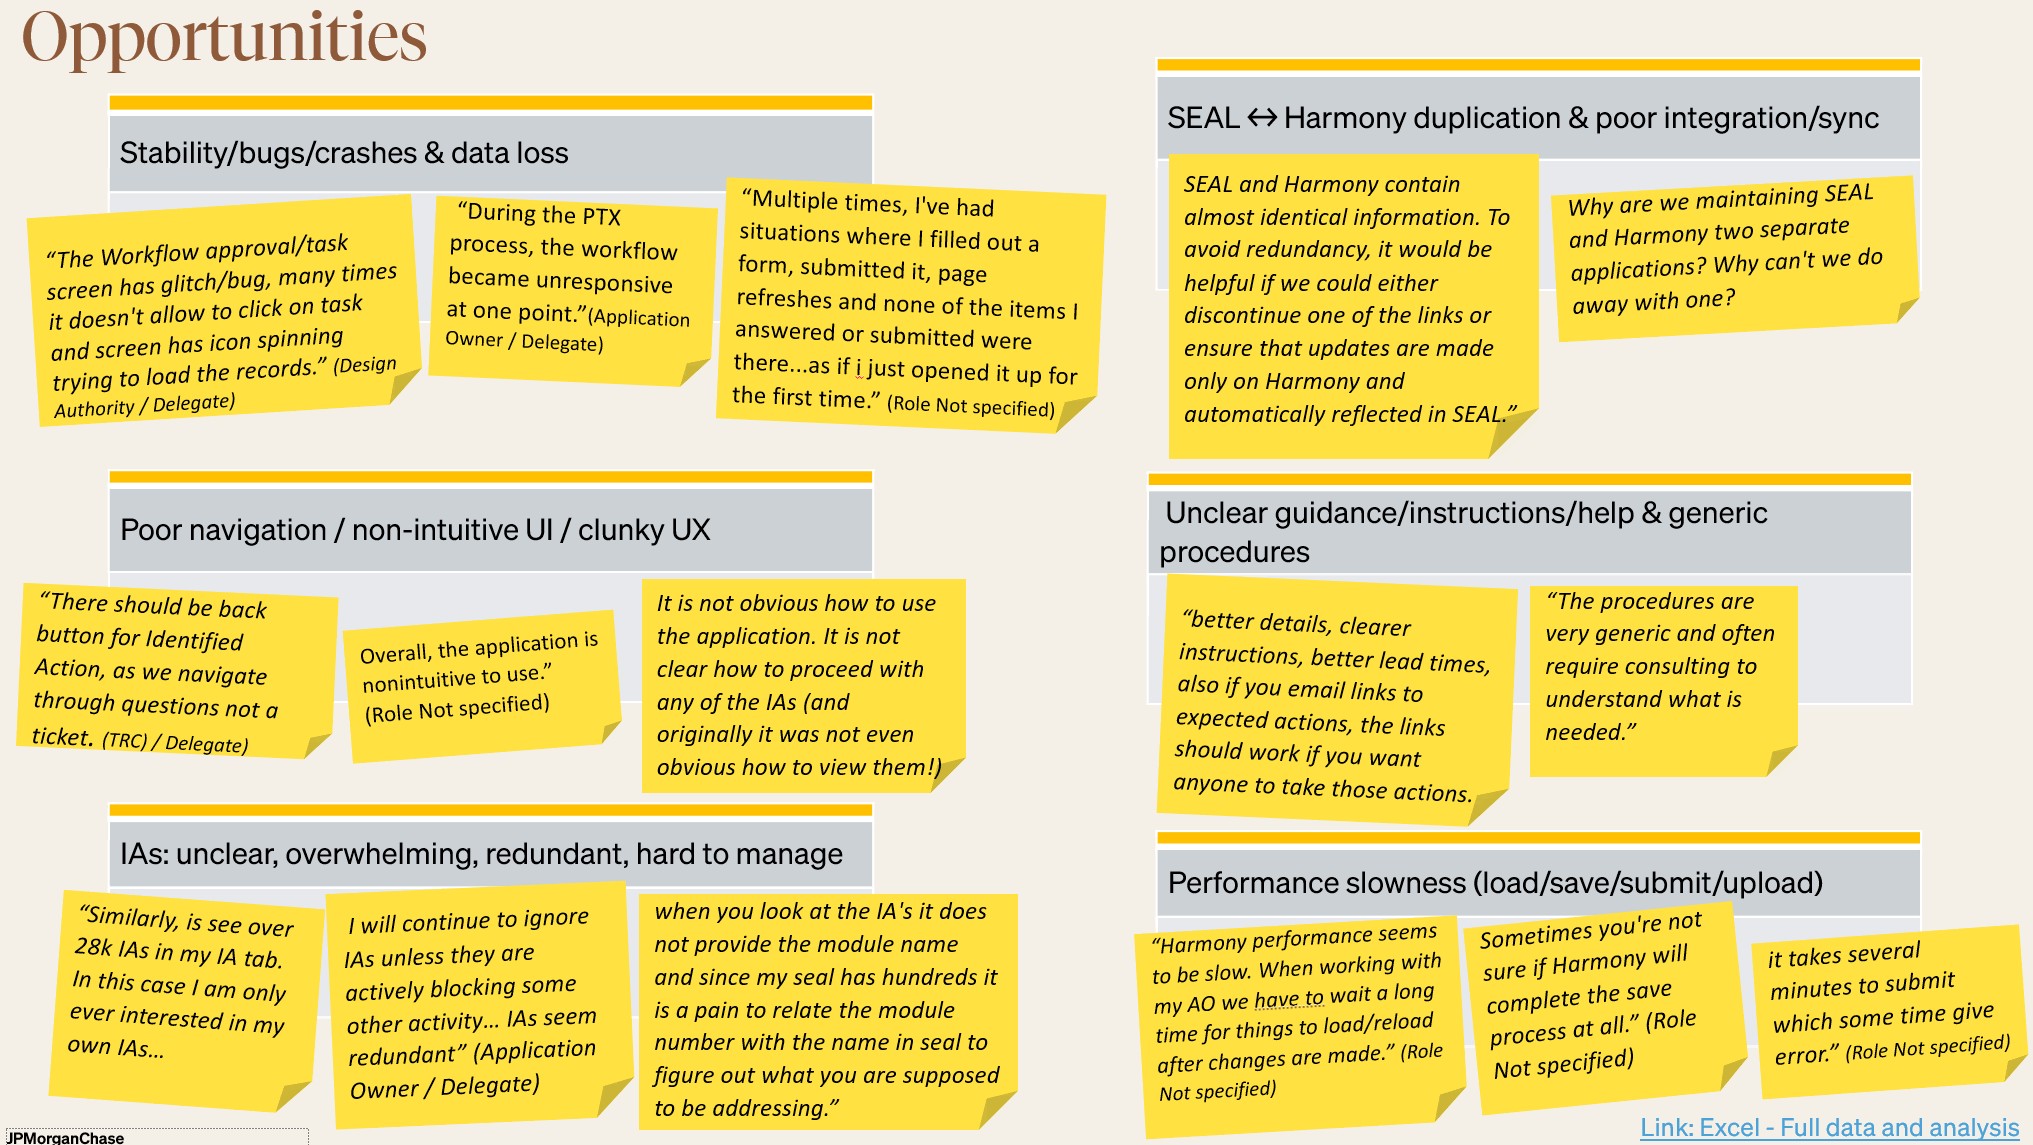
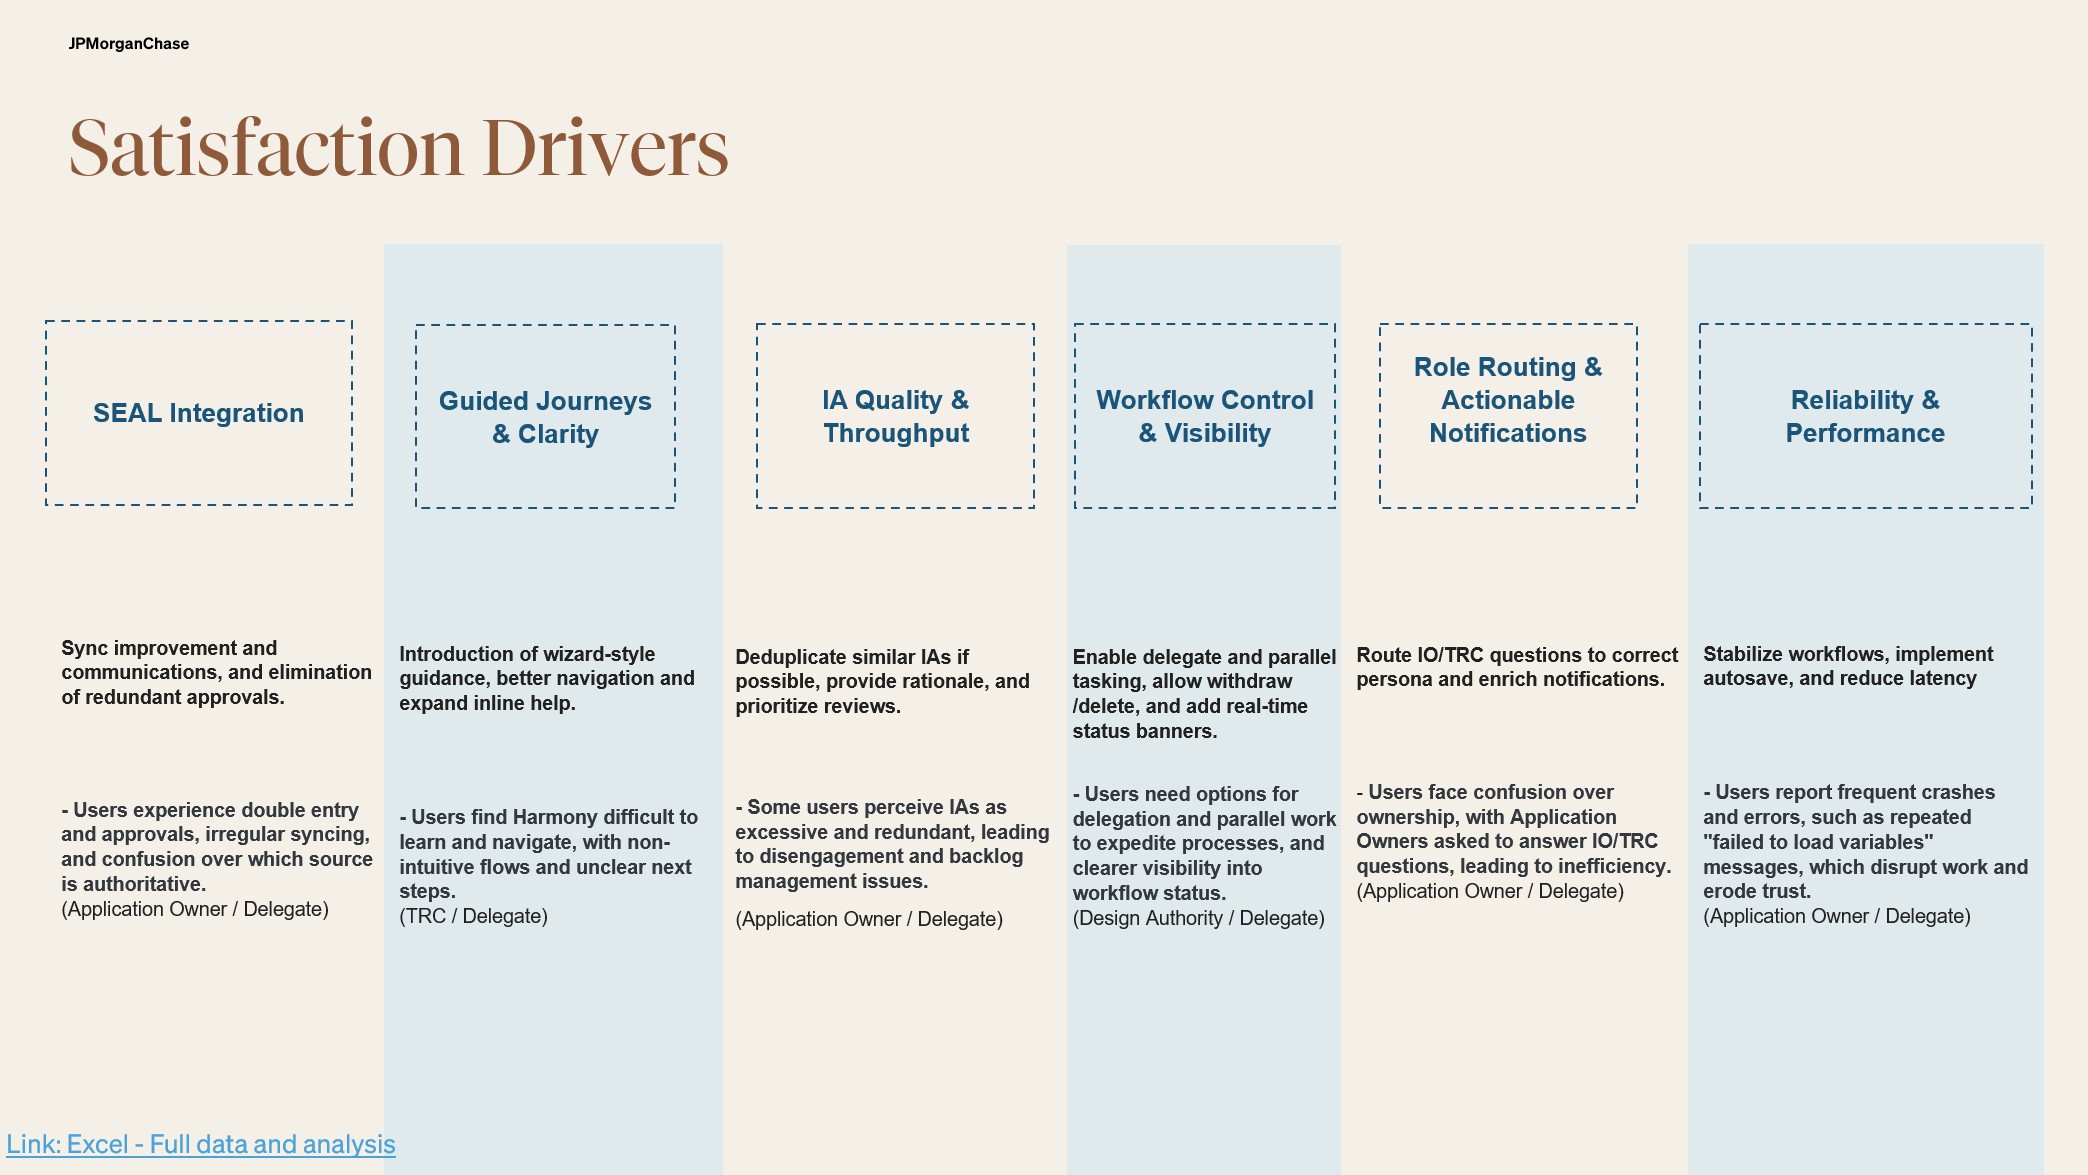
Reliability was an experience problem
Loading failures and lost form data made the platform difficult to rely on.
Design directionPrioritize autosave and recovery alongside performance improvements.
Users needed control over their own workflows
Participants described difficulty withdrawing mistaken requests or understanding stalled work.
Design directionAdd withdrawal options and clearer status visibility.
Aggregate scores concealed role differences
Feedback varied across personas, highlighting needs that the dominant application-owner workflow did not cover.
Design directionUse role-specific follow-up research before generalizing small subgroup results.
Contribution and outcome
Four recommendations adopted into the backlog.
The study informed four priorities adopted into the engineering backlog: autosave, workflow withdrawal, deduplication, and export. Sixty-six respondents opted into follow-up research, giving the team a concrete path from the survey to targeted discovery.
How to read the outcome
102 responses out of 2,935 invitations is approximately 3.5%. Findings describe respondents and carry nonresponse and small-subgroup risks. Backlog adoption is documented; shipped improvements and subsequent satisfaction gains are not claimed.
Reflection
Triangulation strengthened the explanation of recurring problems, but it did not make the sample representative. The right use of this study was to prioritize follow-up and identify actionable friction.Let’s talk through the work