Alex Bai
All selected work

JPMorgan Chase / Developer experience

Helping engineers find the next action.

A usability baseline that separated feature discovery from data trust—and turned both into a prioritized roadmap.

My role

Lead UX Researcher

Context and timing

6 weeks · Q4 2025

Contribution

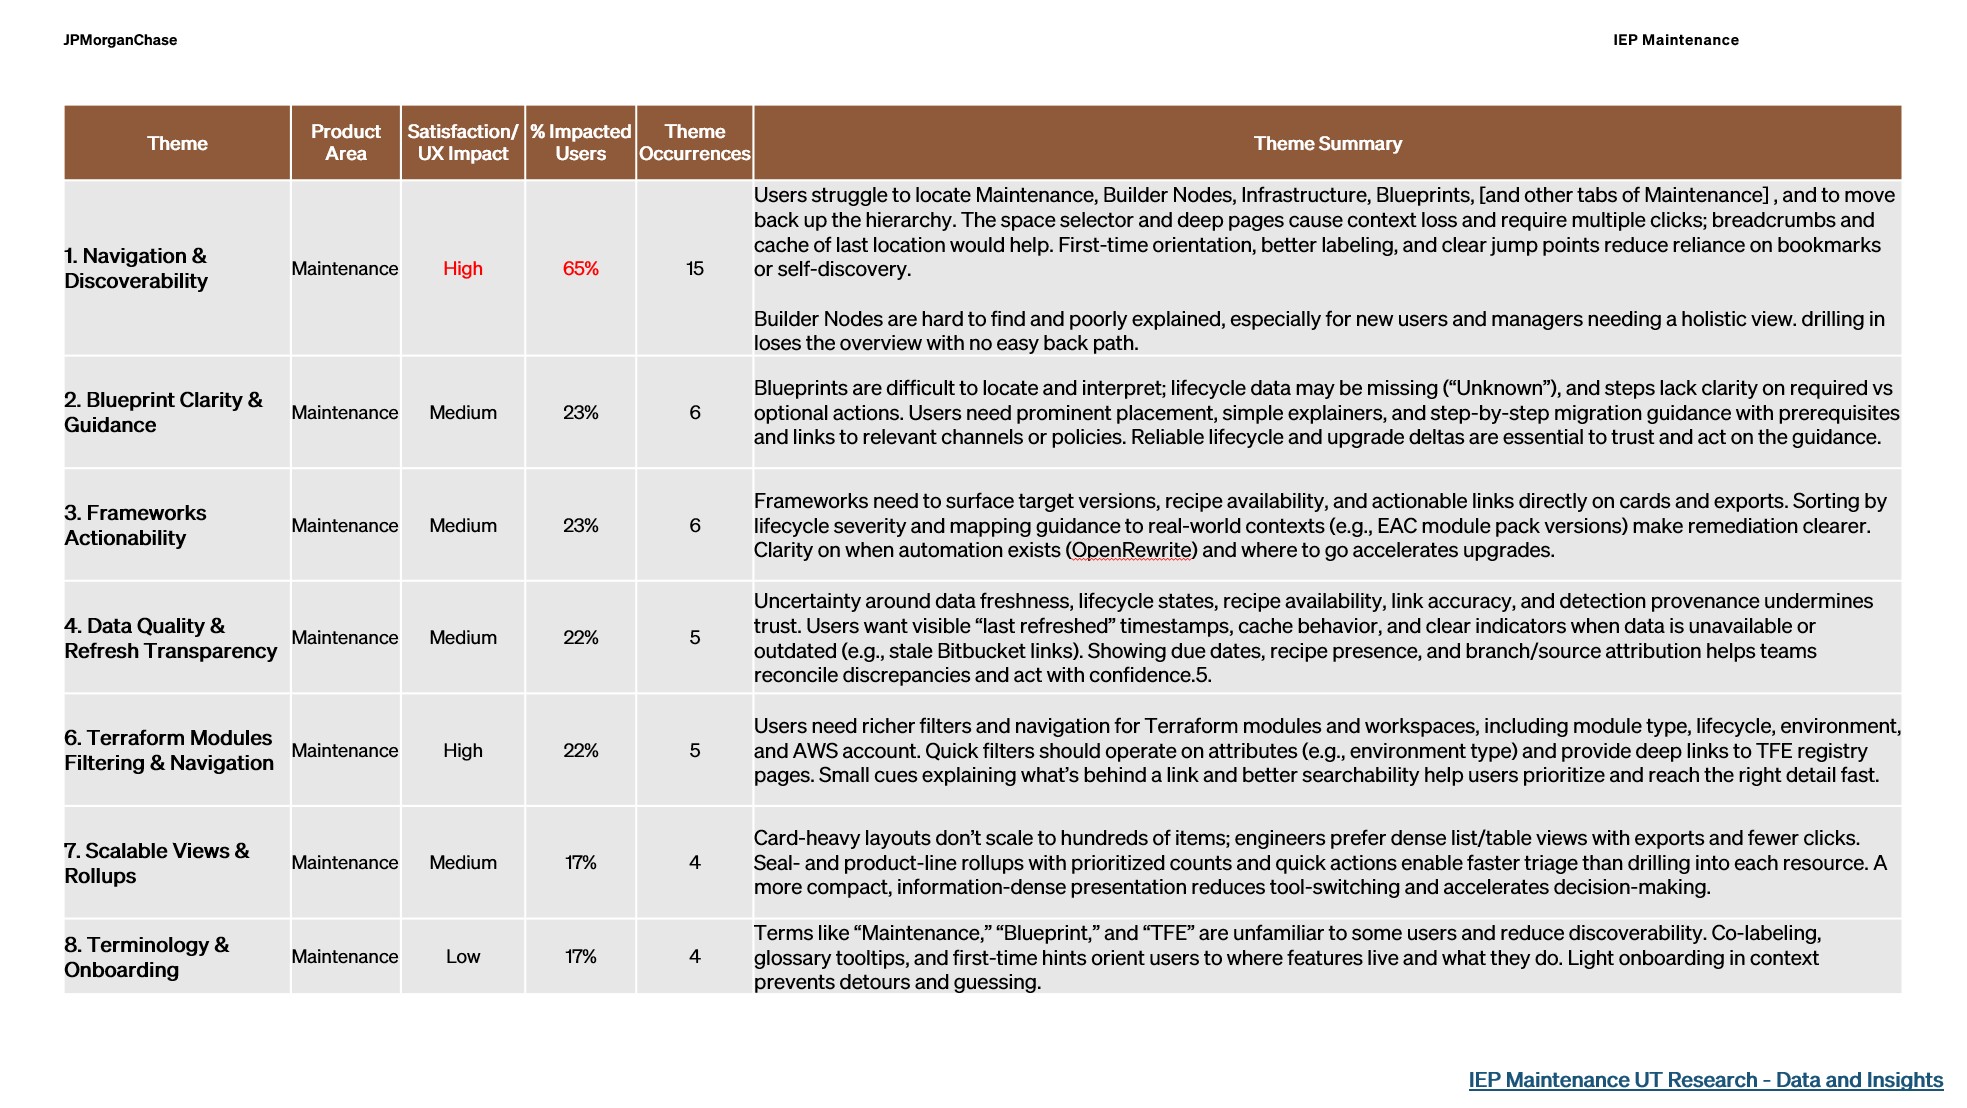
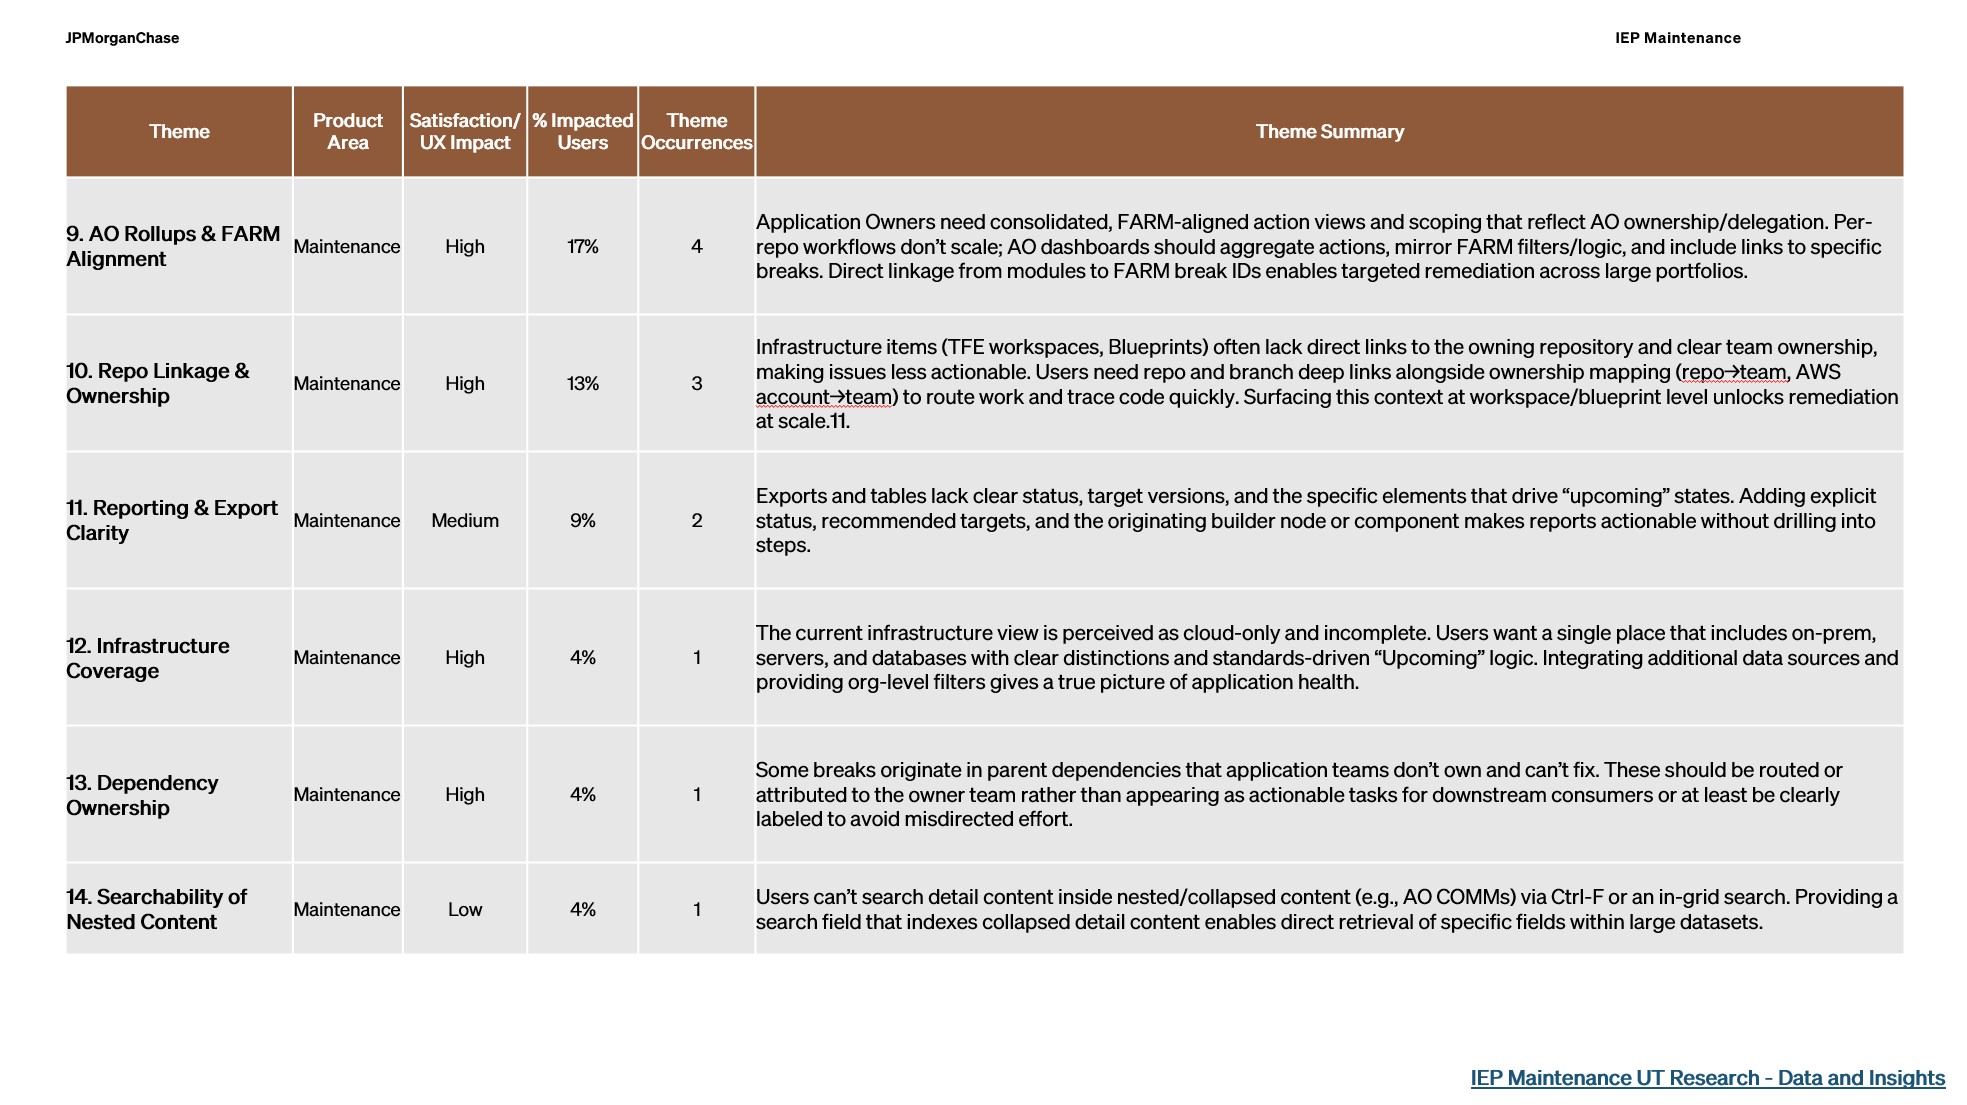
Fourteen themes translated into product priorities

23expert research sessions
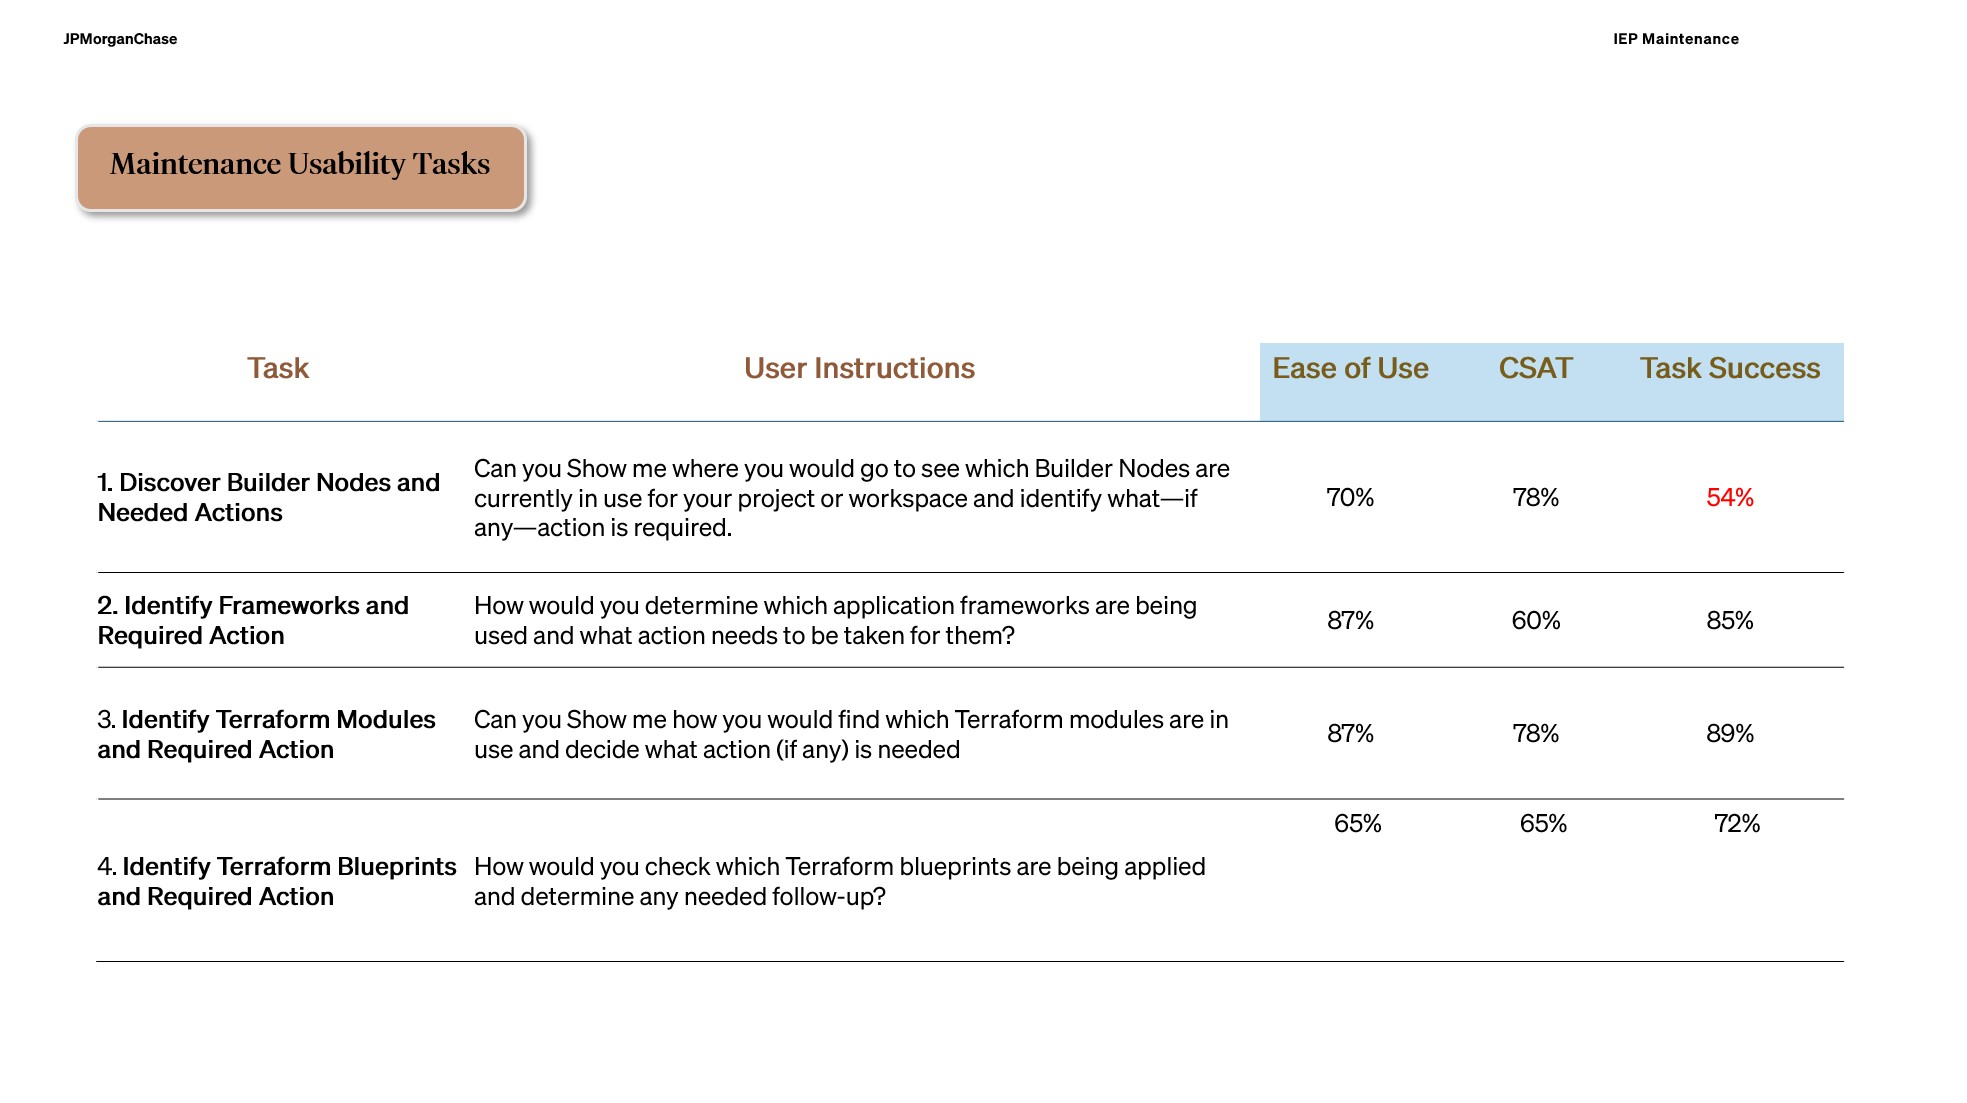
4core maintenance tasks
14usability themes identified
Illustration of layered dashboard windows
IEP project cover illustration from the original portfolio. View full size ↗

The question

Can engineers find what needs attention—and trust what they find?

IEP Maintenance brought framework and infrastructure information into a self-service platform. Around general availability, the team needed a baseline of how well engineers could discover components, interpret their status, and determine a next step. I partnered with product, engineering, design, and research colleagues to turn those questions into four realistic tasks.

Moderated usability testingTask metricsThematic analysisSeverity prioritization

My approach

How I worked through it.

01

Recruit experienced users

The study targeted frequent Maintenance users through platform analytics. Twenty-three participants represented developers, application owners, and hybrid roles across several business areas.

02

Measure behavior and perception together

Moderated sessions covered Builder Nodes, Frameworks, Terraform Modules, and Blueprints. I compared task performance with effort and satisfaction, then coded recurring friction.

03

Prioritize for action

I ranked themes by breadth of impact, experience severity, and recurrence. AI-assisted transcript analysis was checked against manually coded sessions before the final synthesis.
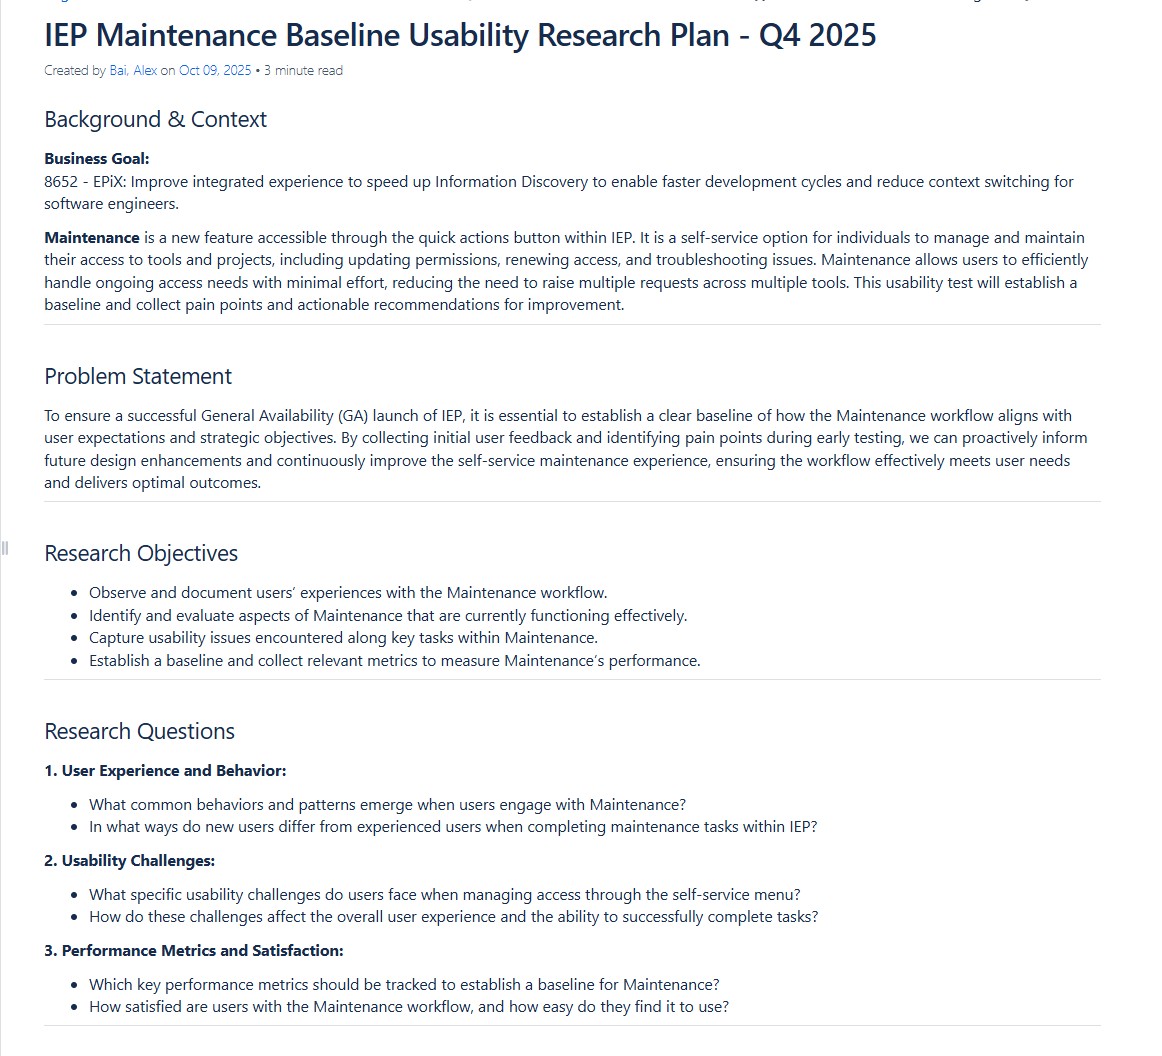
The research plan defines the background, objectives, and questions for the usability baseline.
The research plan defines the background, objectives, and questions for the usability baseline. View full size ↗
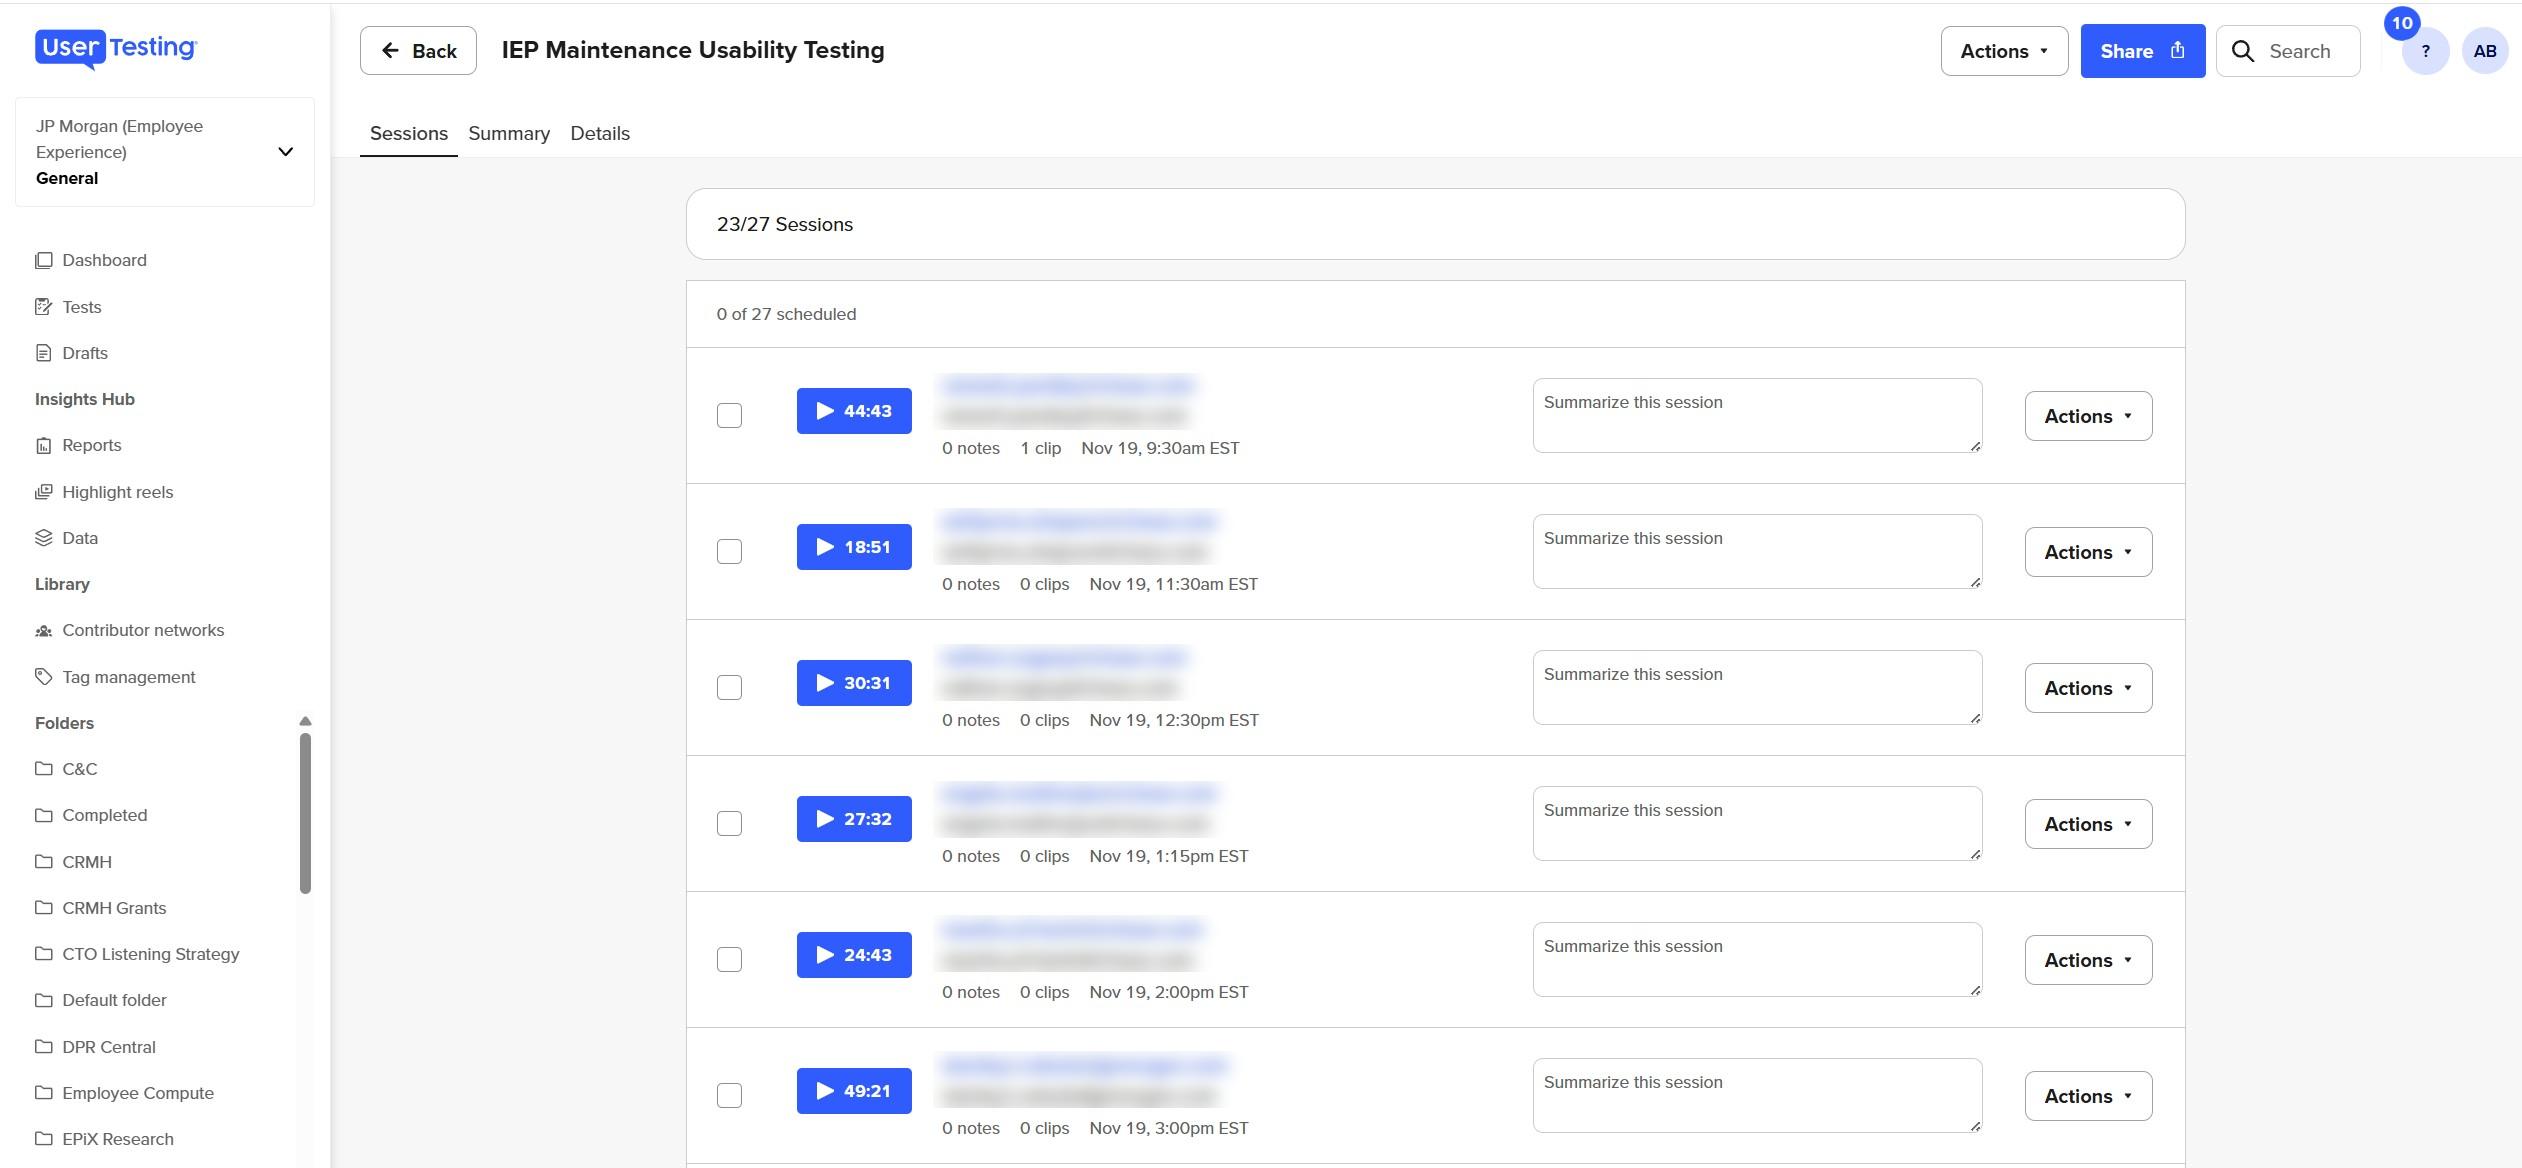
The moderated study setup in UserTesting.
The moderated study setup in UserTesting. View full size ↗
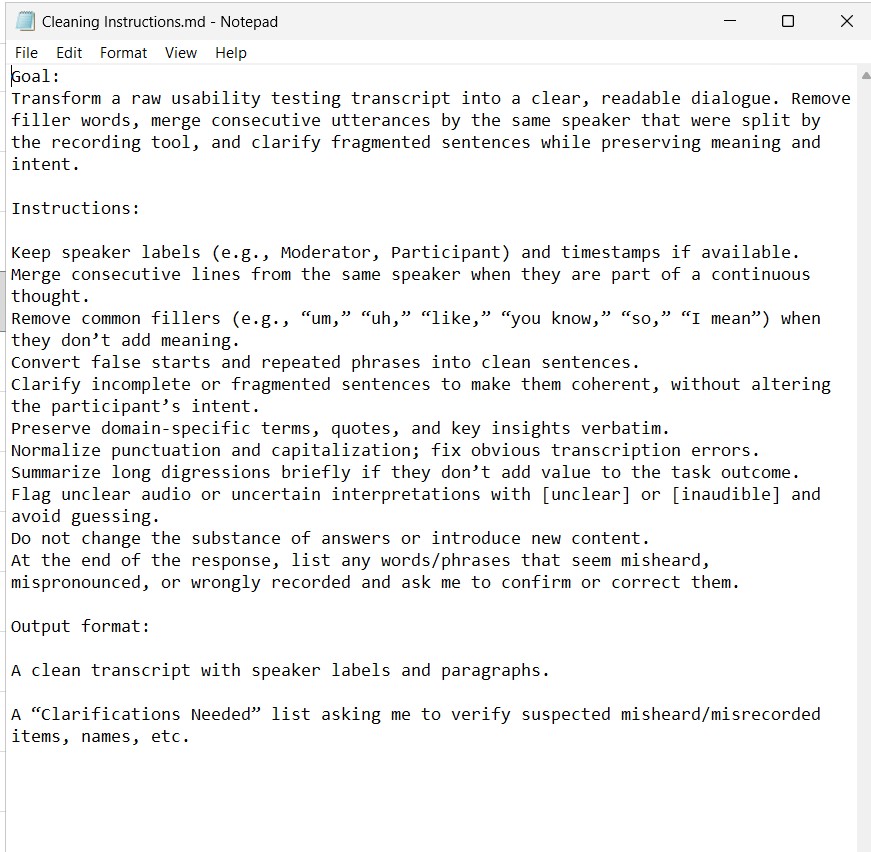
Instructions for preparing transcripts before AI-assisted synthesis, with manual review in the research process.
Instructions for preparing transcripts before AI-assisted synthesis, with manual review in the research process. View full size ↗

Baseline task success

Discovery was uneven.

Builder Nodes54%
Frameworks85%
Terraform Modules89%
Terraform Blueprints72%
Reported task-success rates from the baseline study. Overall study: 23 expert sessions. Task-specific denominators are not supplied in this summary.

Evidence to decisions

What mattered. What it changed.

Finding a feature was not the same as using it

Builder Node discovery had the lowest reported task success at 54%. Framework discovery reached 85%, yet framework satisfaction was only 60%.

Design directionAddress navigation and actionability as separate design problems.

Unknown data undermined confidence

Missing lifecycle information and unclear refresh or source metadata made it difficult to trust the maintenance view.

Design directionExpose data freshness, source context, and explicit target versions.

Dense workflows needed a clearer hierarchy

Users managing many components needed actionable priorities and ownership context, not equal visual weight for every item.

Design directionPrioritize lifecycle severity, support compact lists, and route dependencies to the right owner.
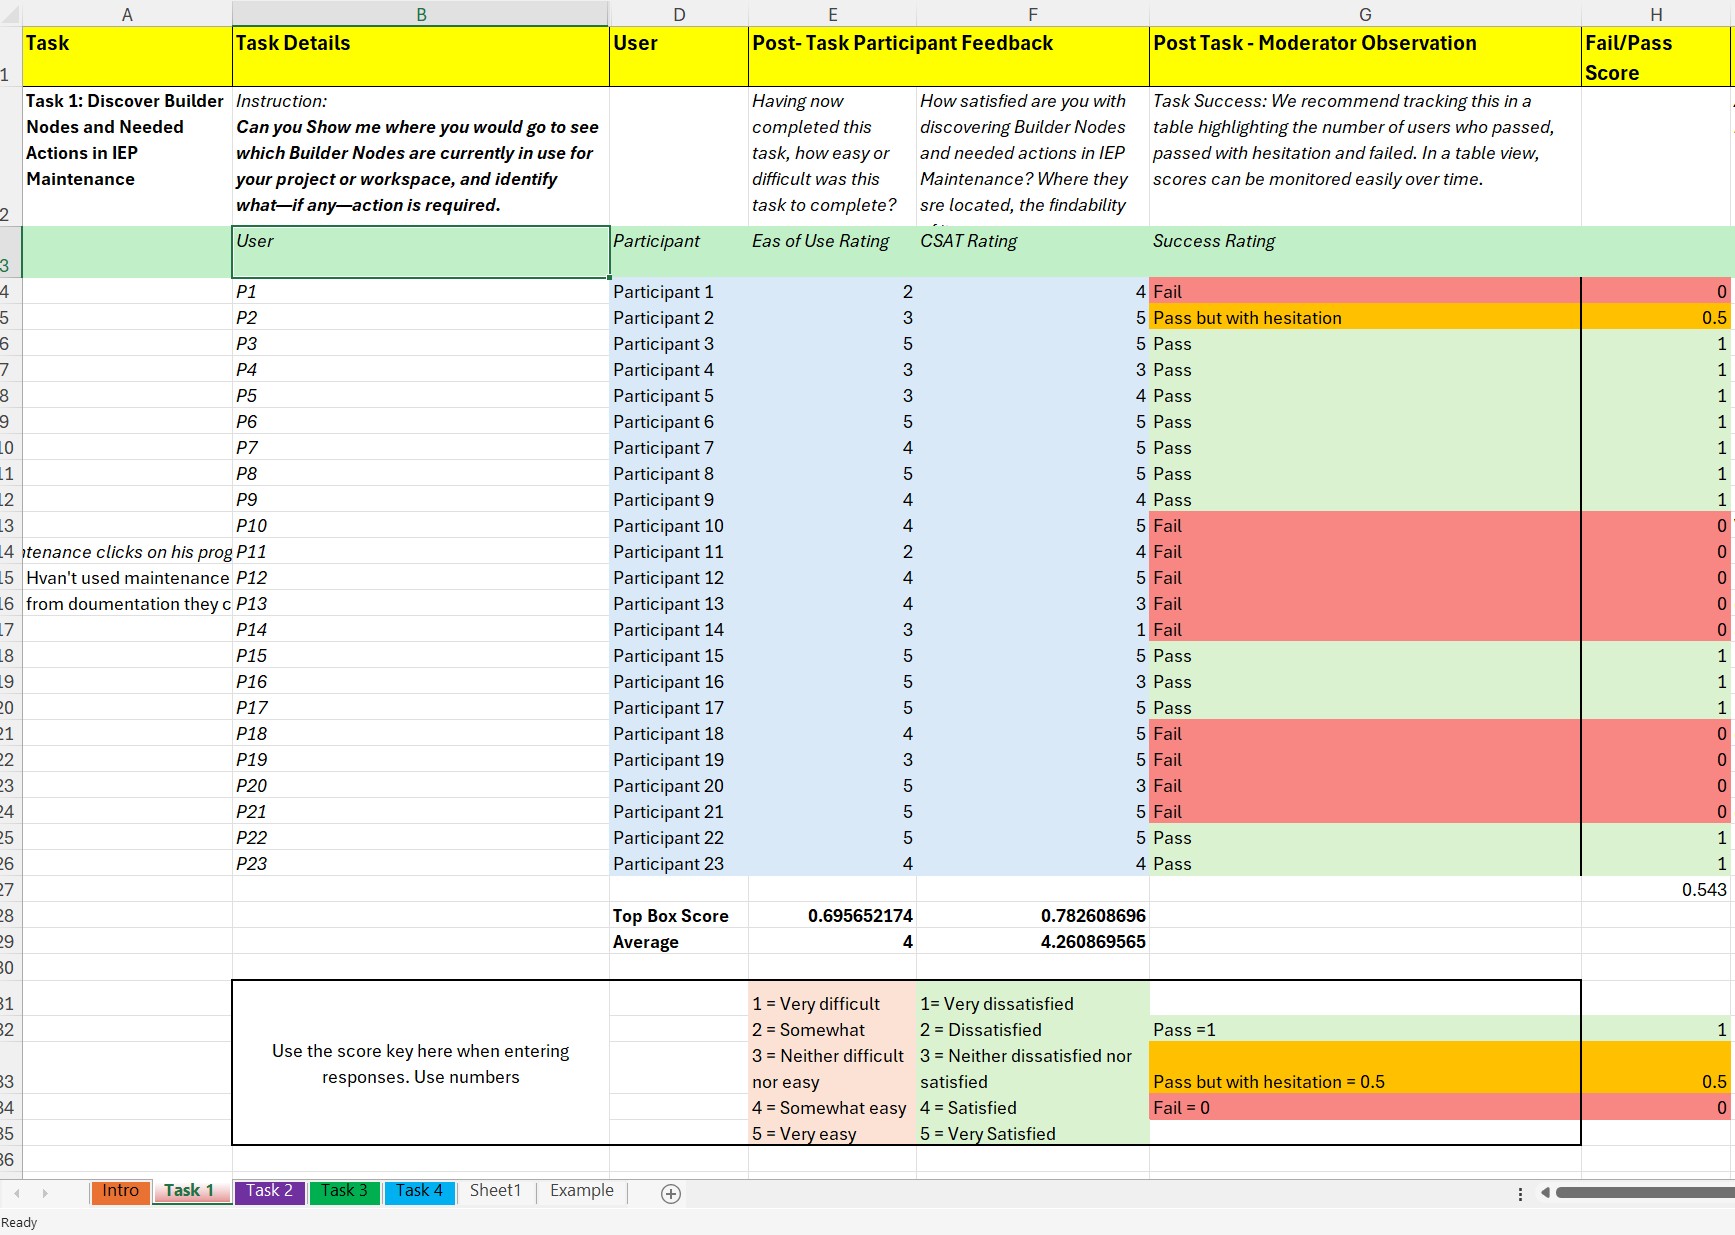
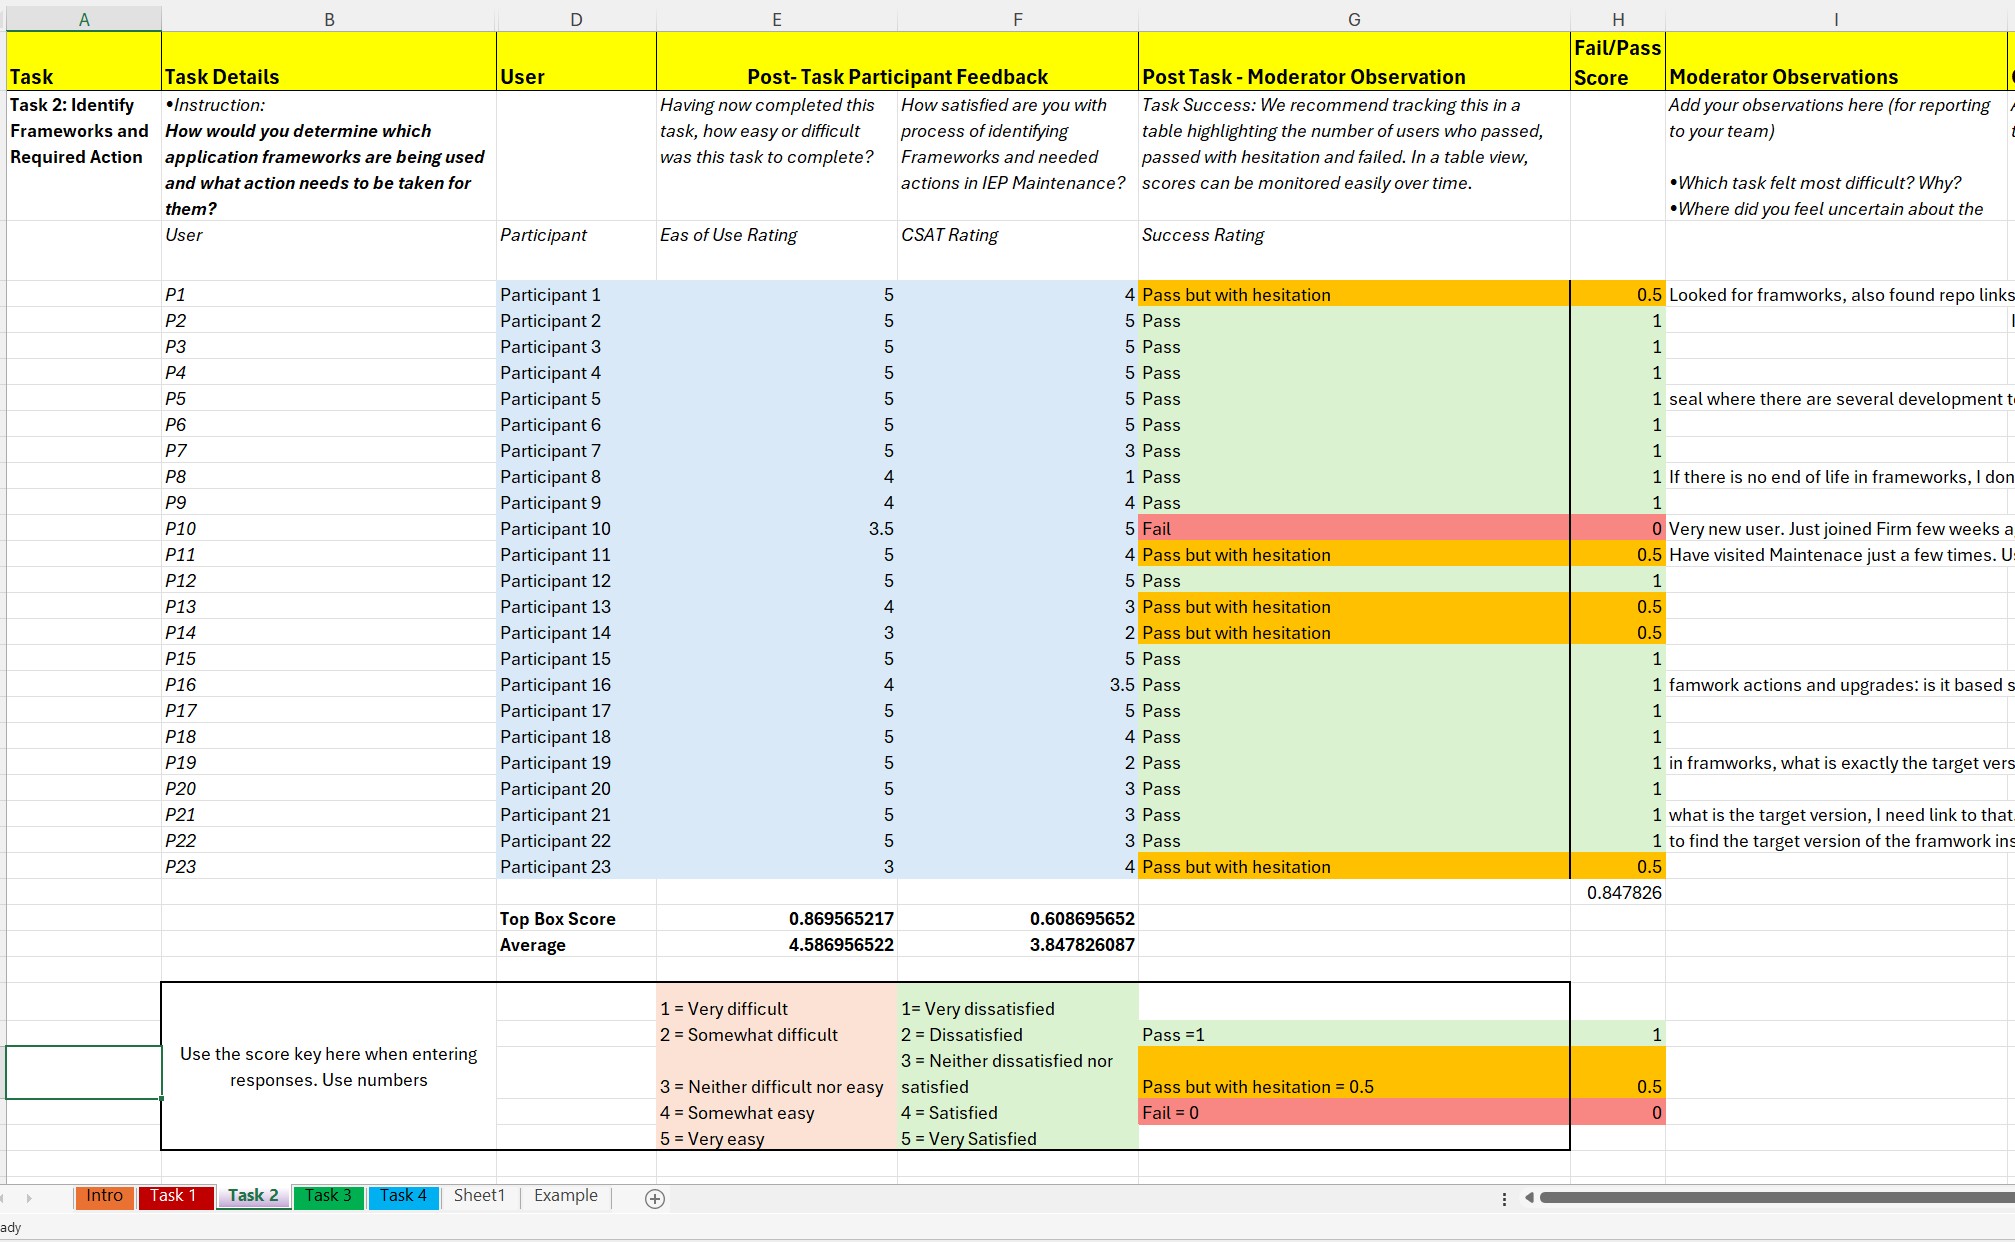
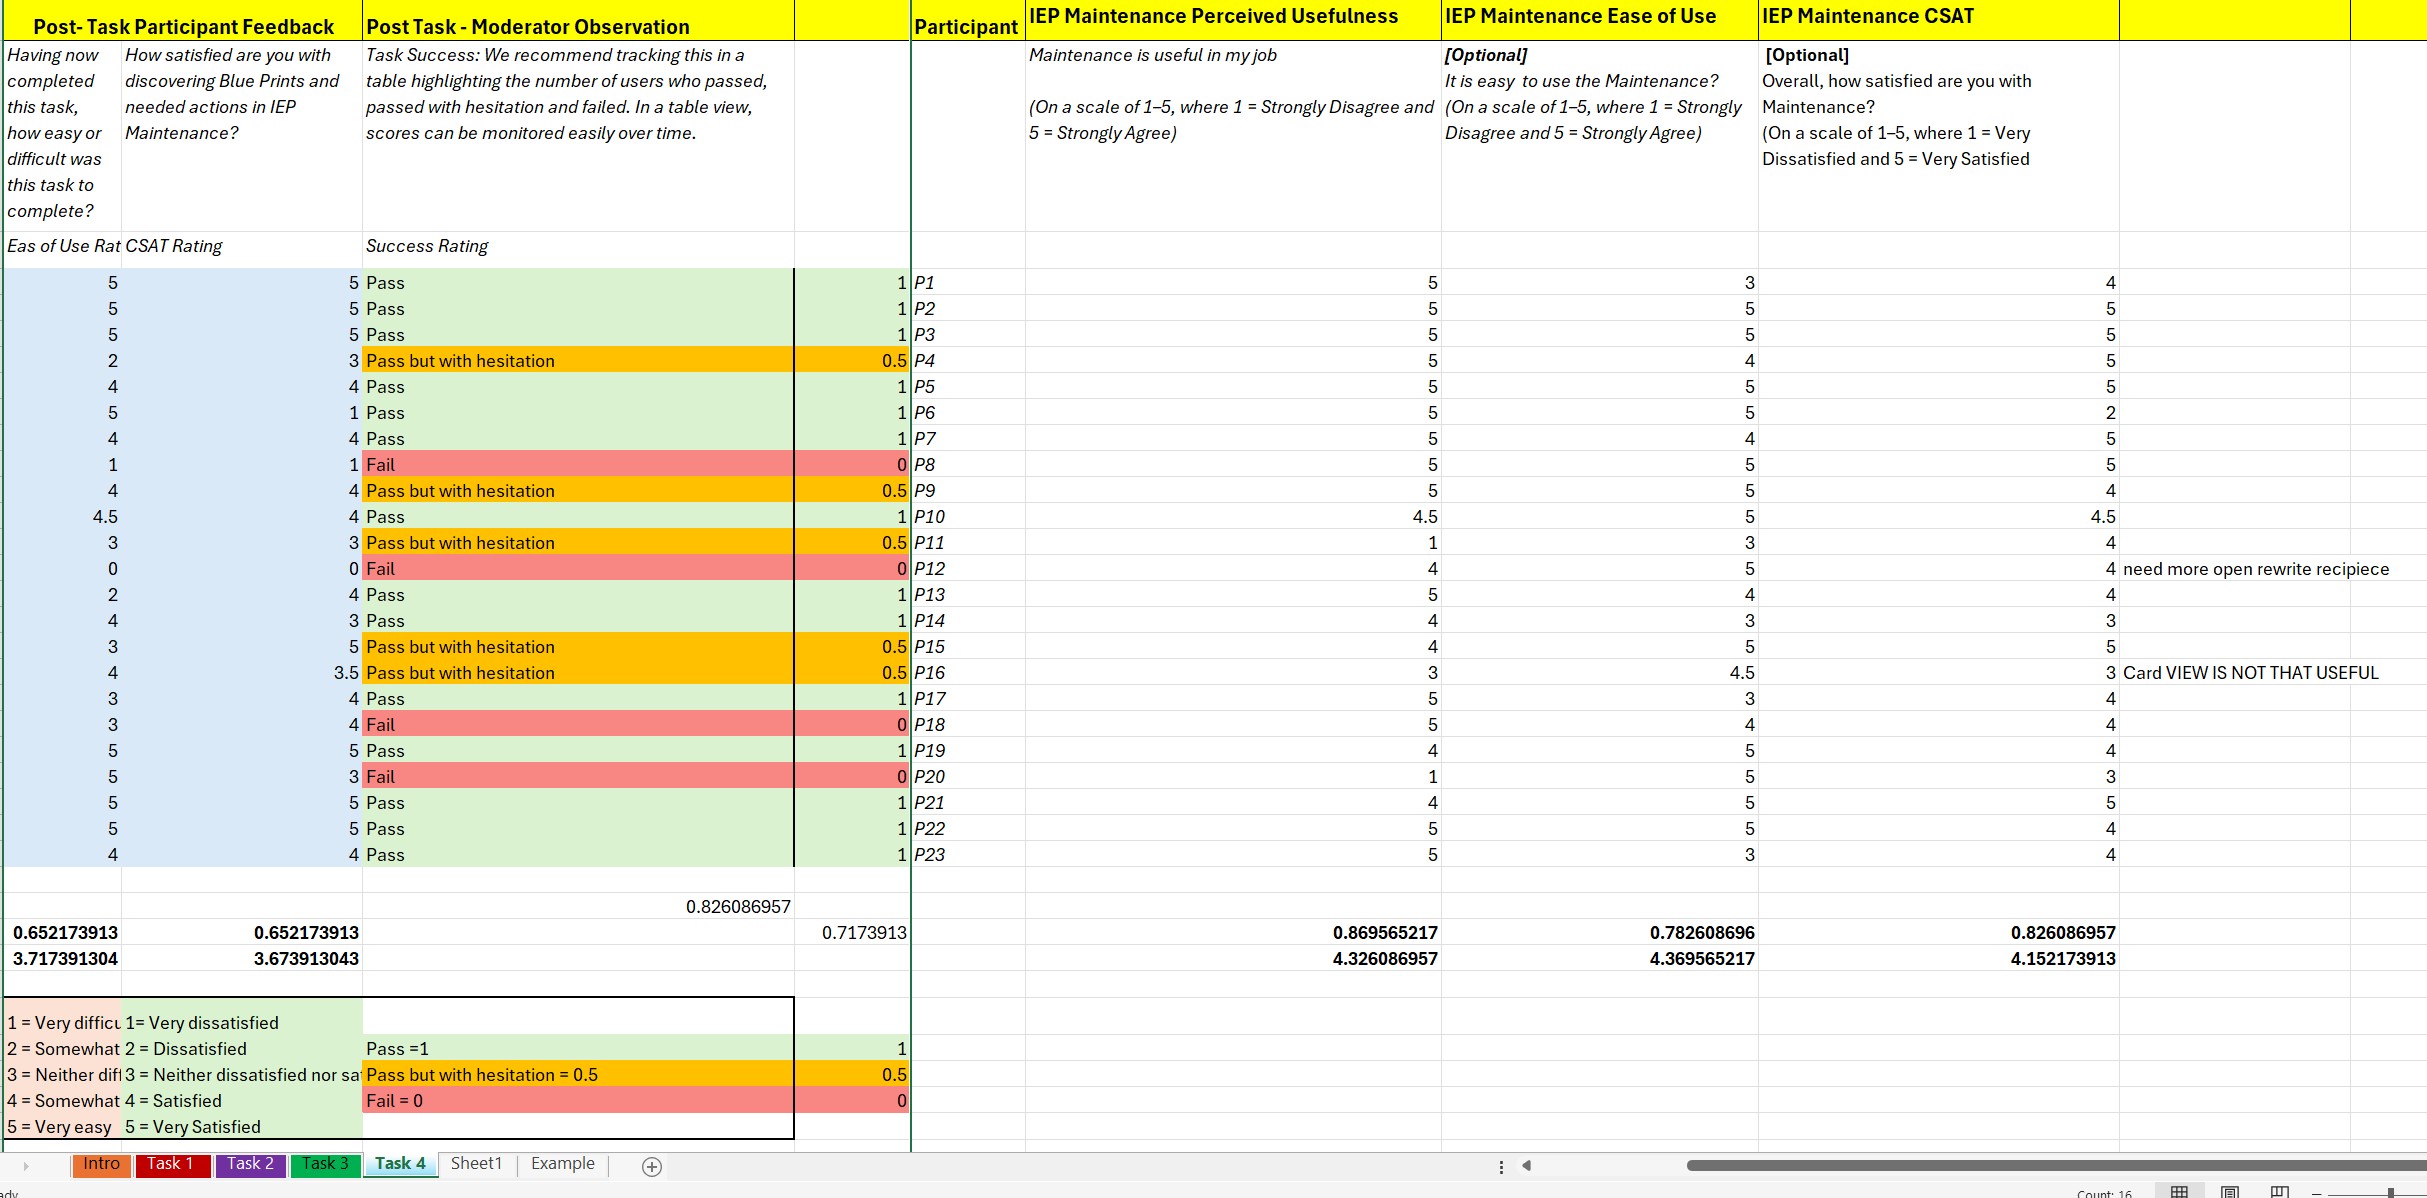
Builder Nodes: task-level scoring, participant observations, and ratings.
Builder Nodes: task-level scoring, participant observations, and ratings. View full size ↗
Frameworks: the scoring sheet records task performance and participant feedback.
Frameworks: the scoring sheet records task performance and participant feedback. View full size ↗
Terraform tasks: observations and scores for infrastructure discovery and evaluation.
Terraform tasks: observations and scores for infrastructure discovery and evaluation. View full size ↗
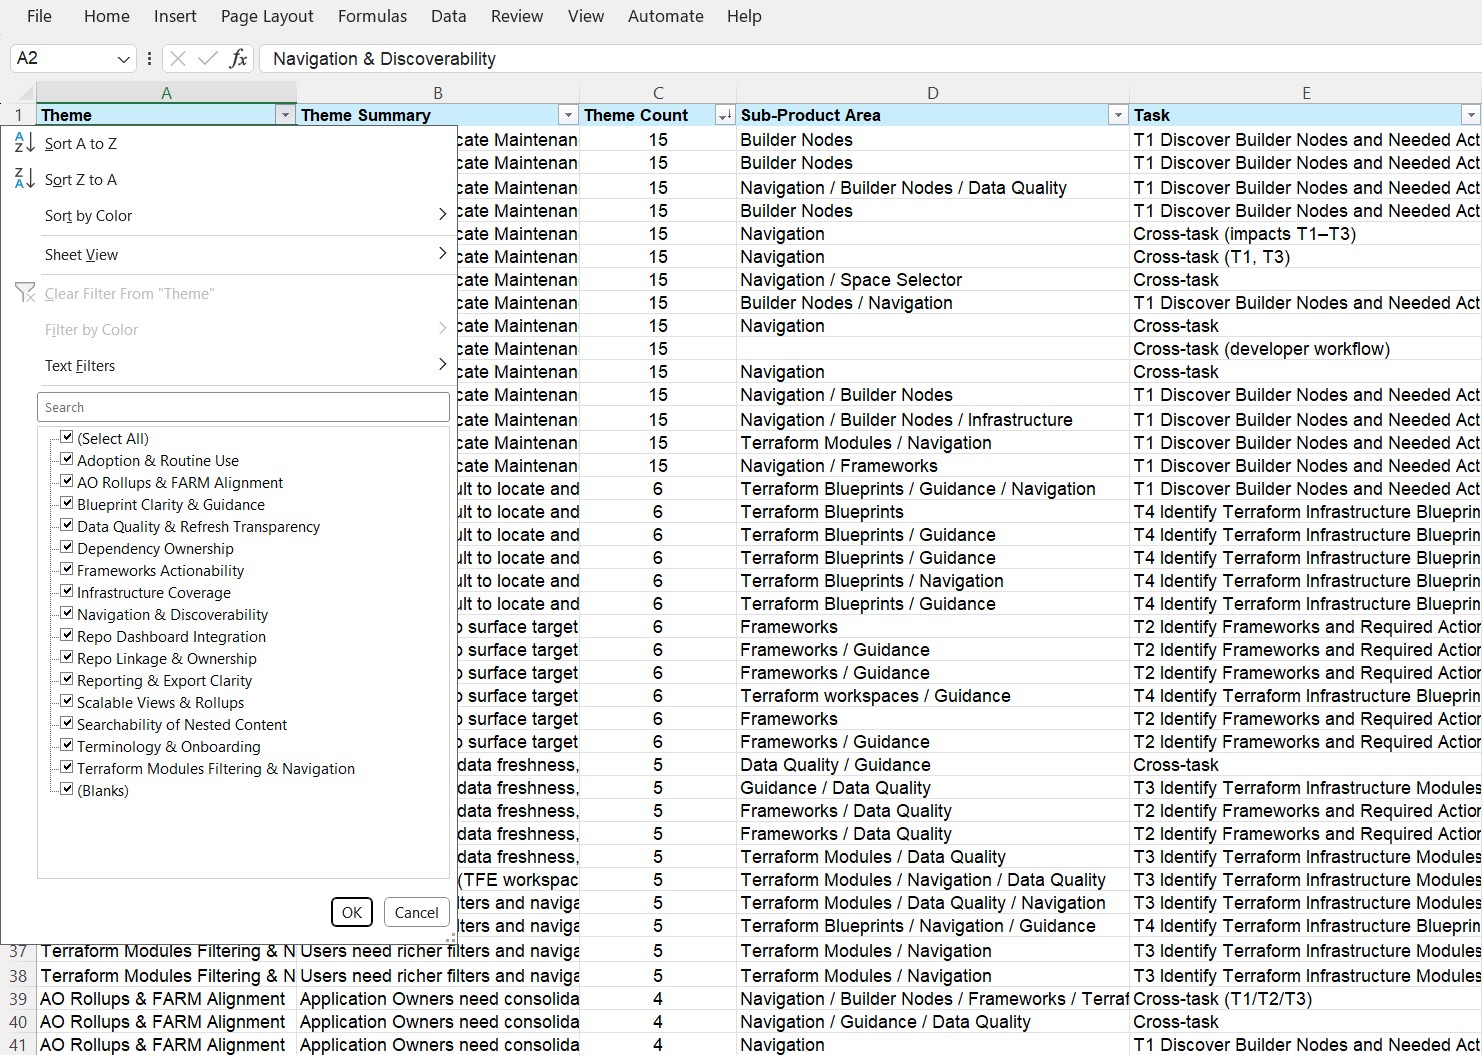
The synthesis workbook connects observed issues with themes and product areas.
The synthesis workbook connects observed issues with themes and product areas. View full size ↗

Contribution and outcome

Fourteen themes translated into product priorities.

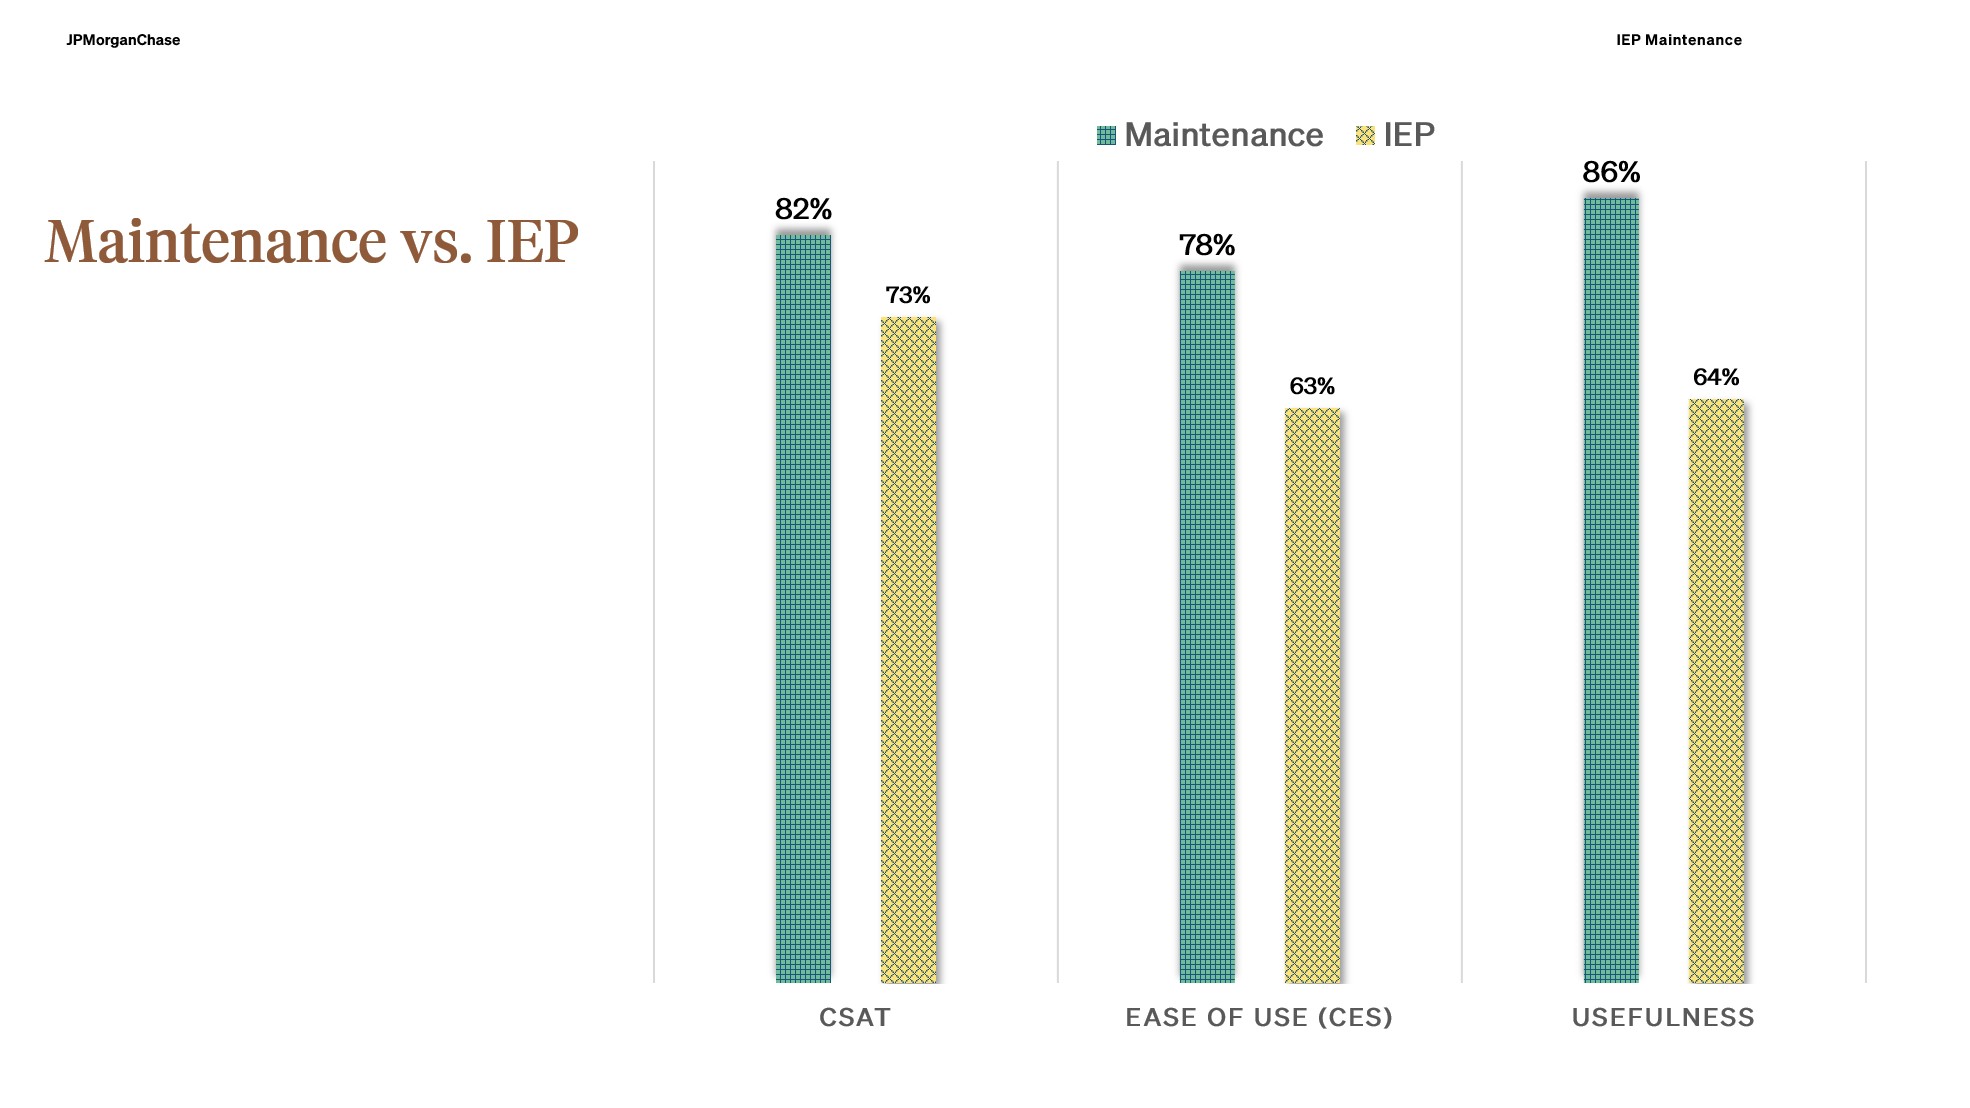
The study established reported baseline scores of 86% usefulness, 82% satisfaction, and 78% ease of use. Fourteen themes became a severity-based set of recommendations and a baseline for tracking subsequent changes.

How to read the outcome

Task success and satisfaction values describe the baseline study. They establish where the experience started; they do not measure the effect of subsequent product changes.

Explore the research readout 12 presentation slides
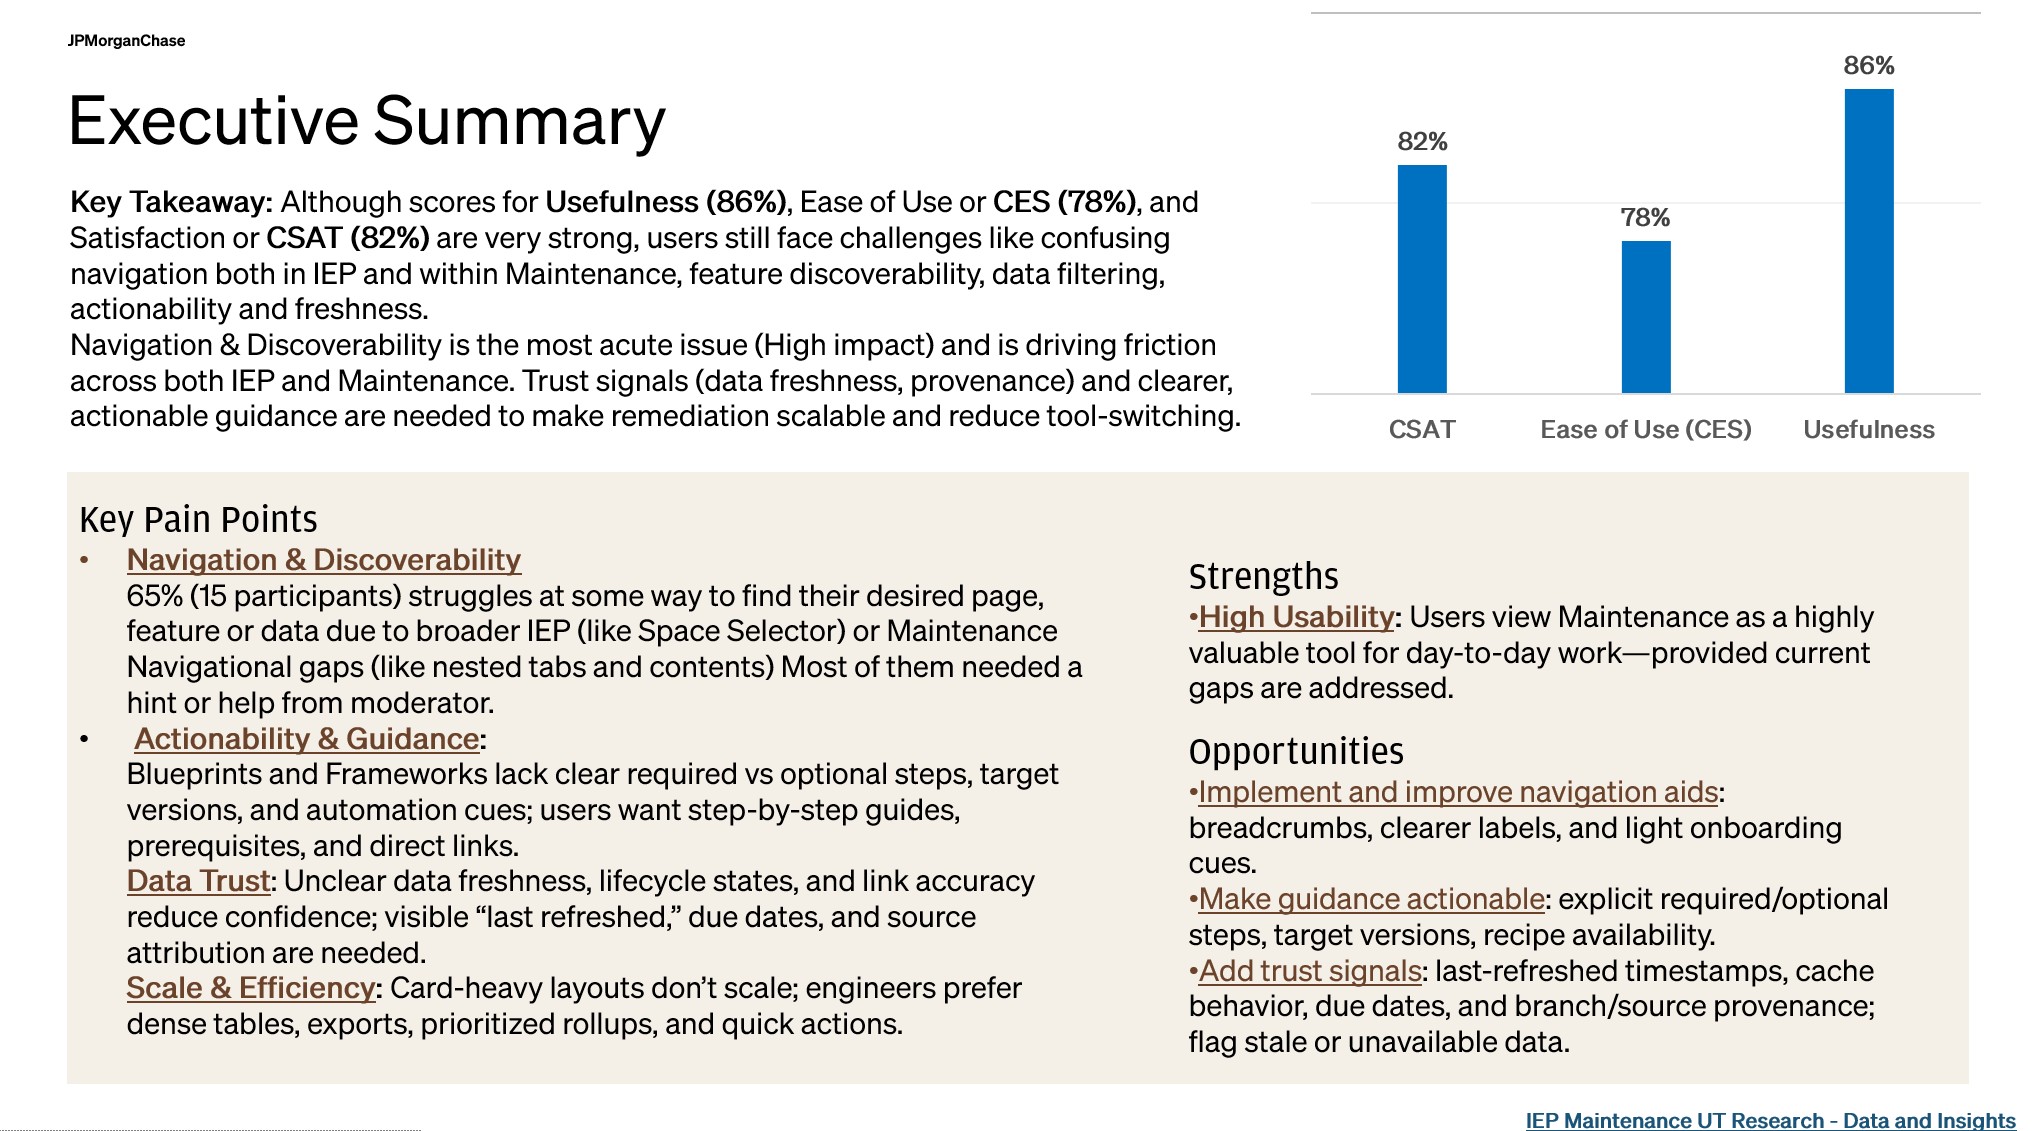
Executive summary: baseline scores, strengths, and the highest-priority pain points.
Executive summary: baseline scores, strengths, and the highest-priority pain points. View full size ↗
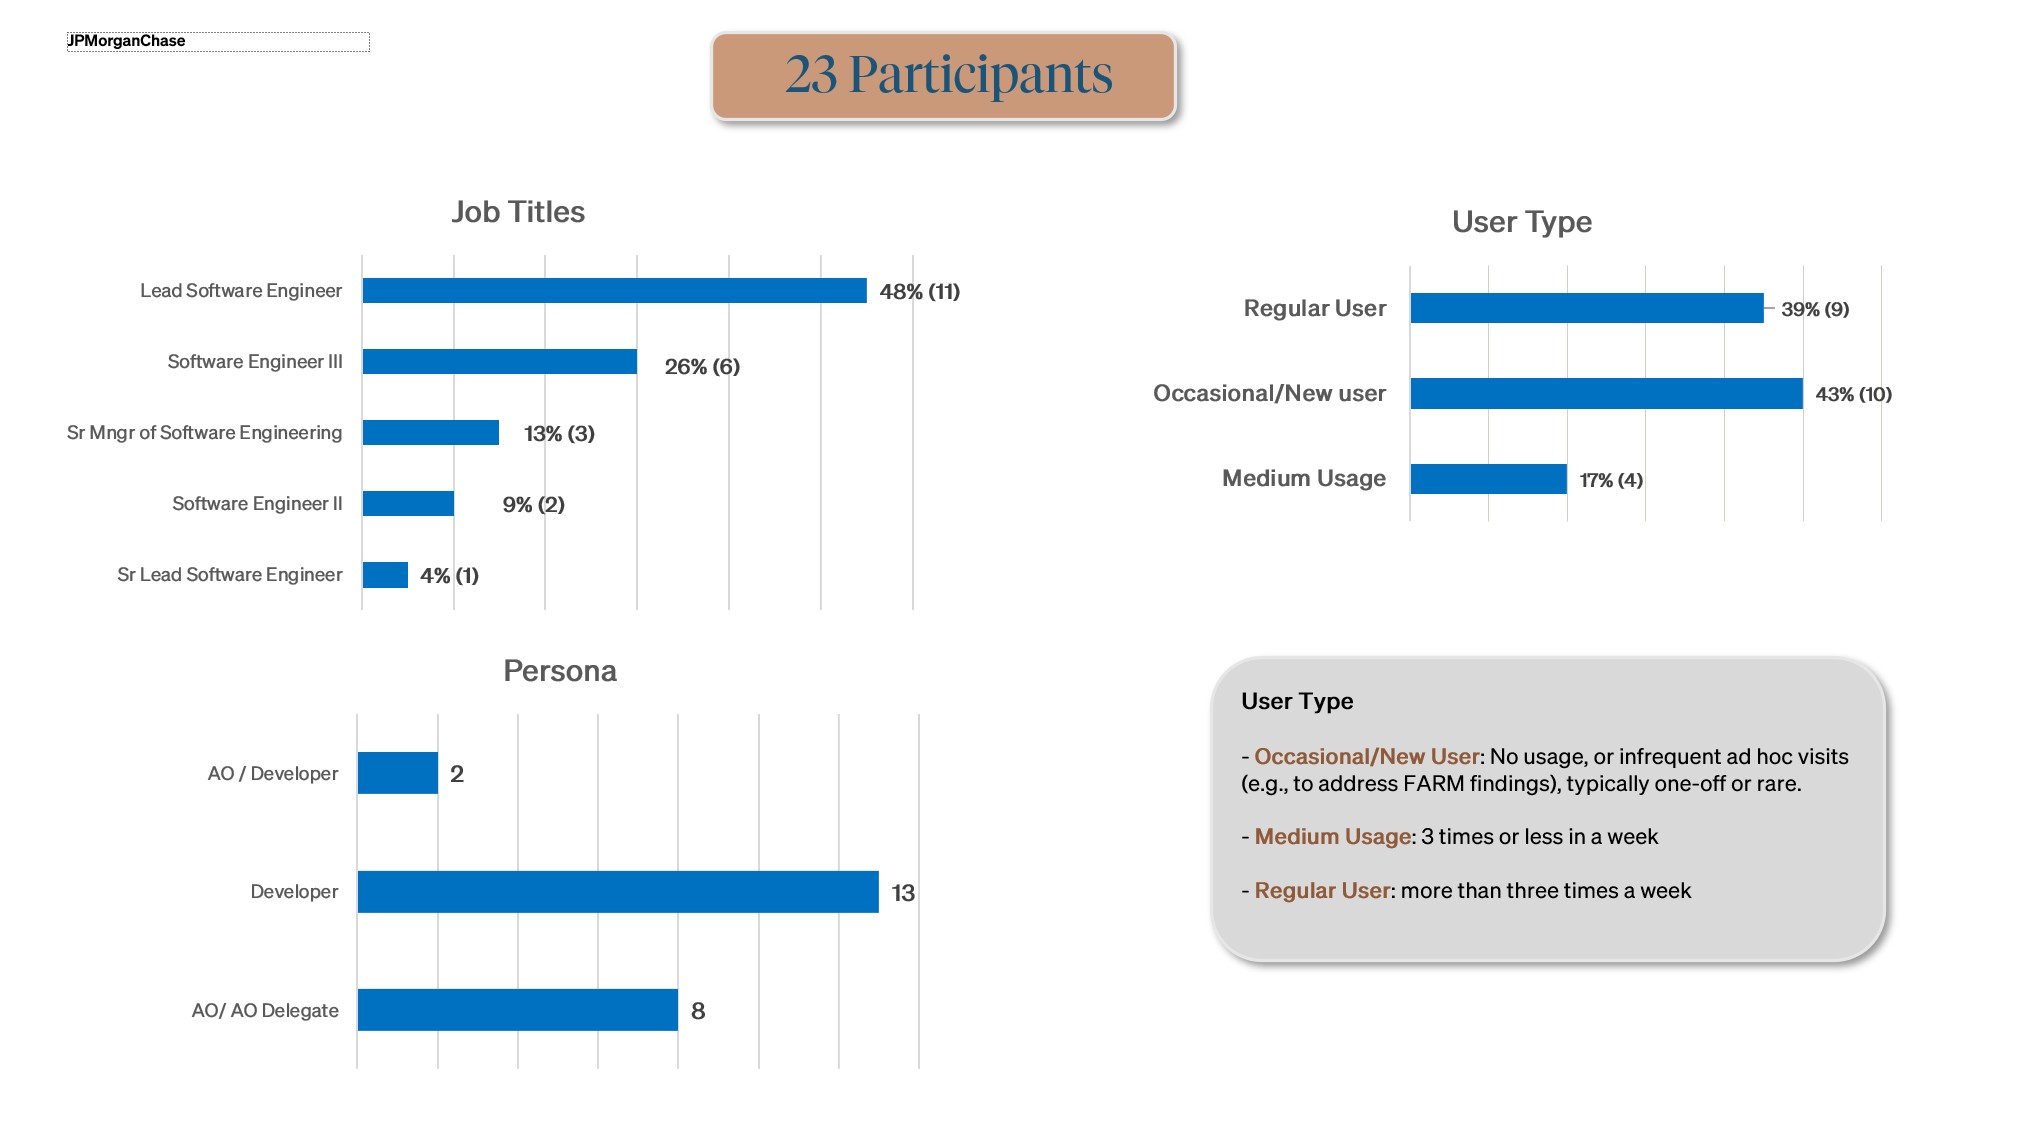
Participant profile: job titles, personas, and usage patterns.
Participant profile: job titles, personas, and usage patterns. View full size ↗
The four usability tasks, instructions, and reported baseline measures.
The four usability tasks, instructions, and reported baseline measures. View full size ↗
Maintenance compared with the broader IEP experience across satisfaction, effort, and usefulness.
Maintenance compared with the broader IEP experience across satisfaction, effort, and usefulness. View full size ↗
Prioritization table: themes, impacted users, severity, and supporting observations.
Prioritization table: themes, impacted users, severity, and supporting observations. View full size ↗
Additional prioritized themes across AI recommendations, infrastructure, reporting, and ownership.
Additional prioritized themes across AI recommendations, infrastructure, reporting, and ownership. View full size ↗
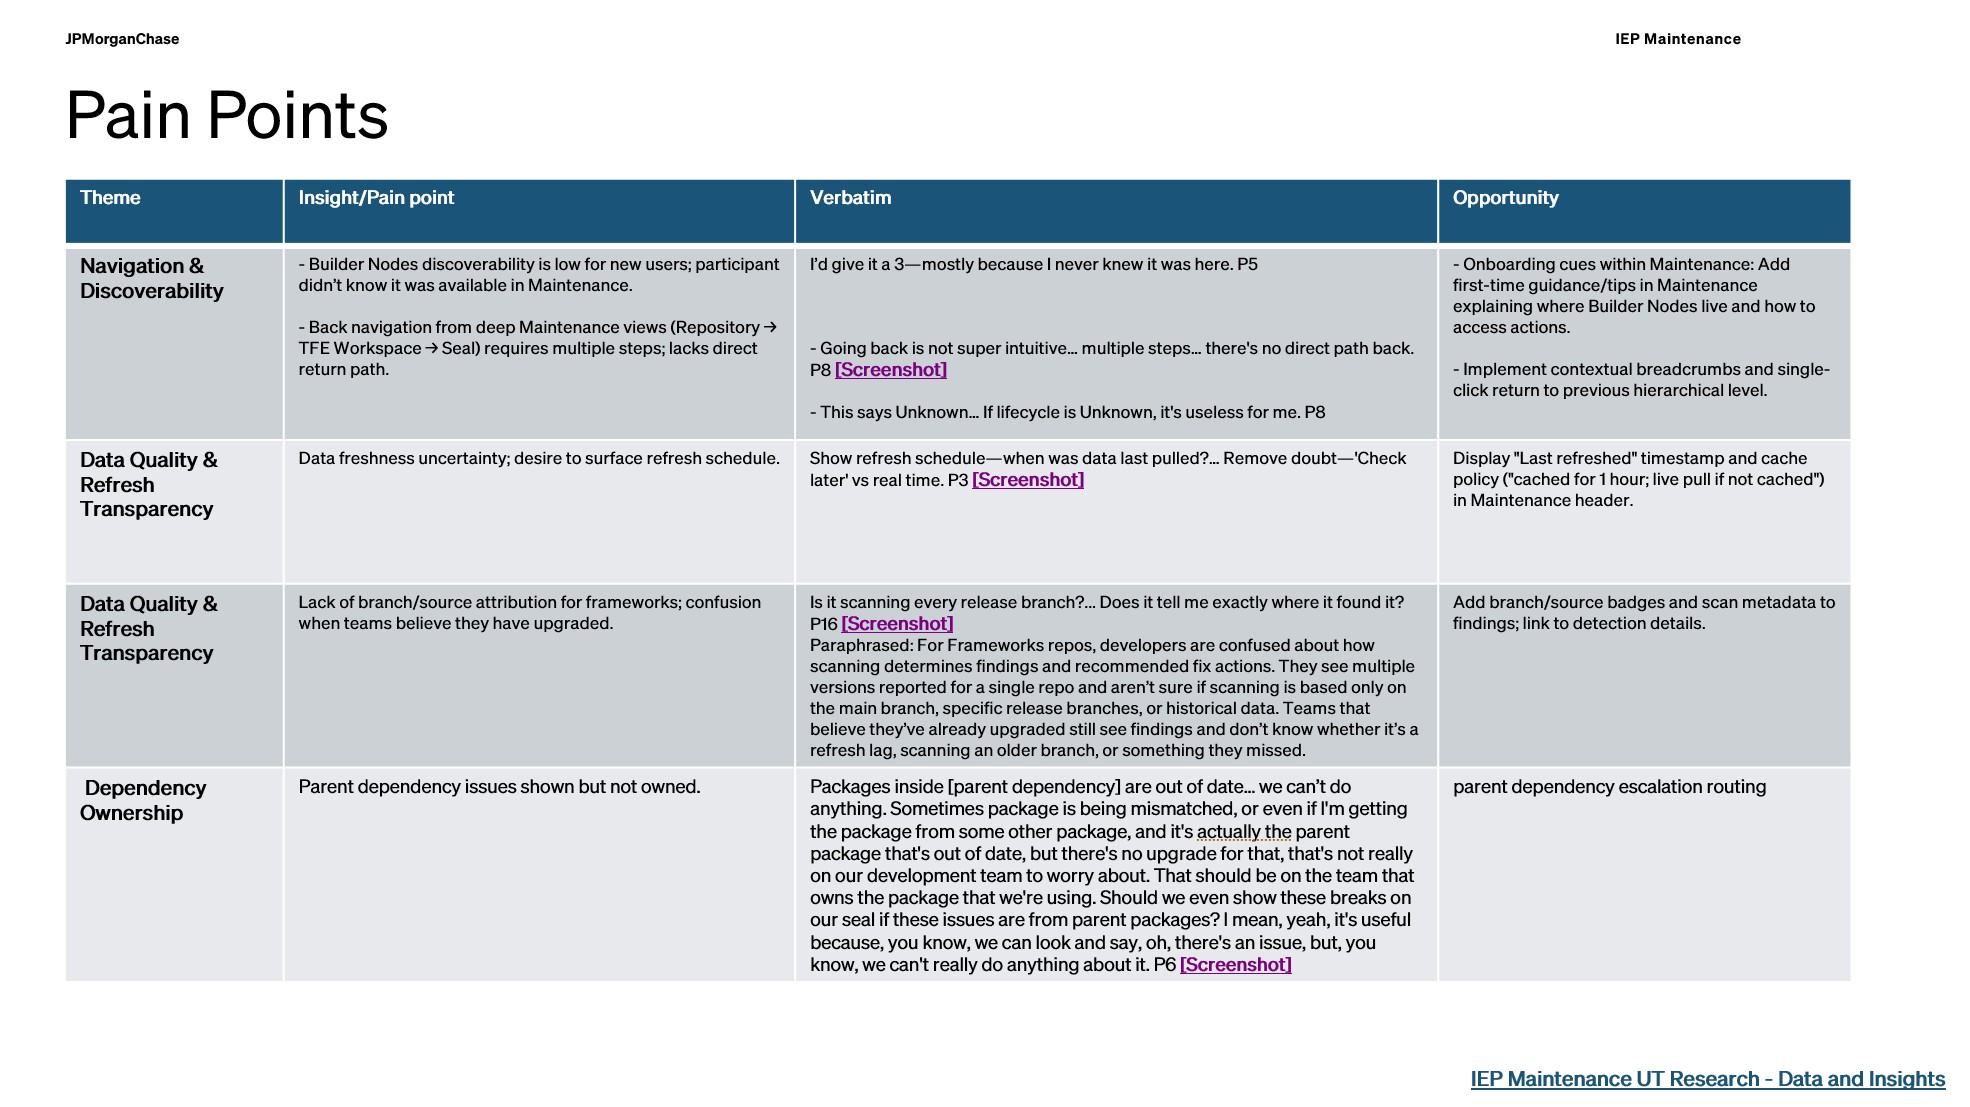
Pain points mapped to participant verbatim and potential product opportunities.
Pain points mapped to participant verbatim and potential product opportunities. View full size ↗
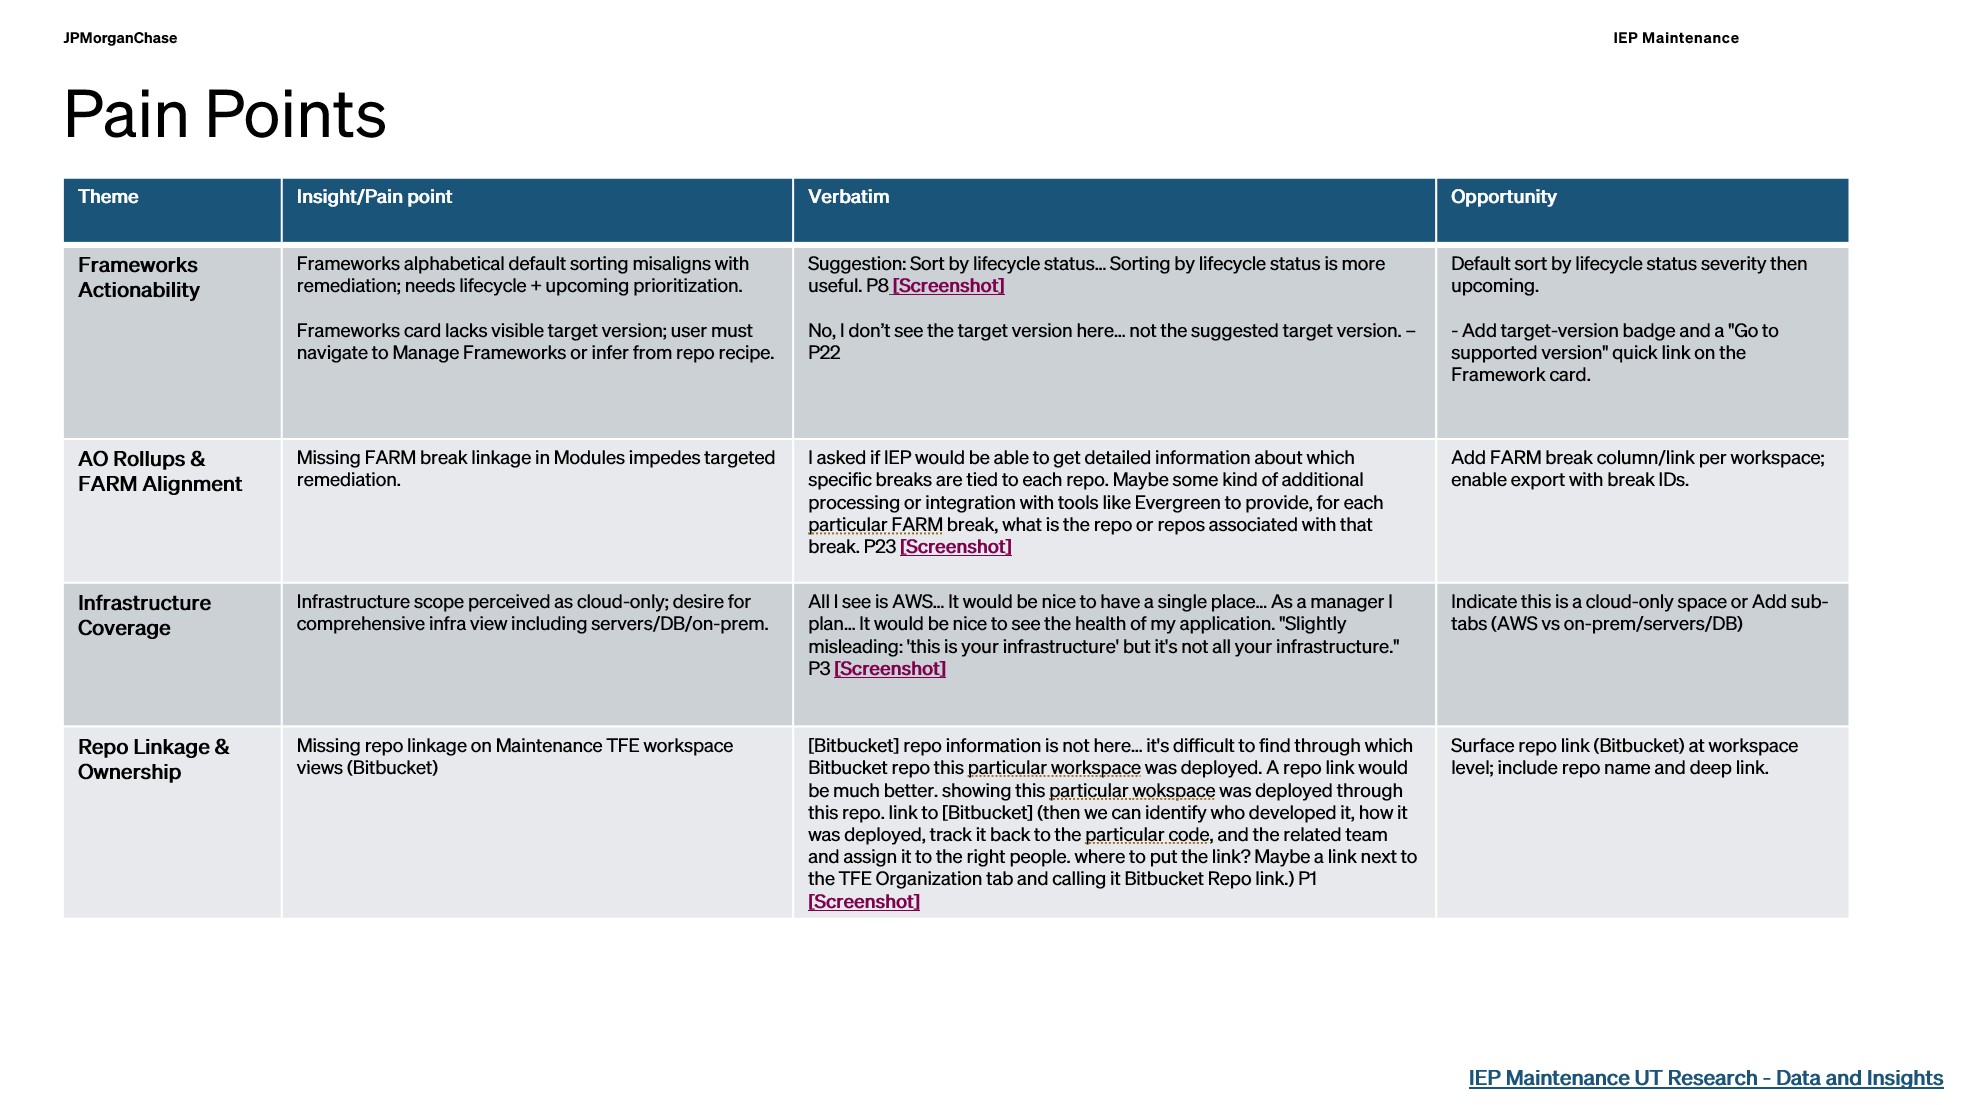
Further pain points and opportunities around actionability and infrastructure context.
Further pain points and opportunities around actionability and infrastructure context. View full size ↗
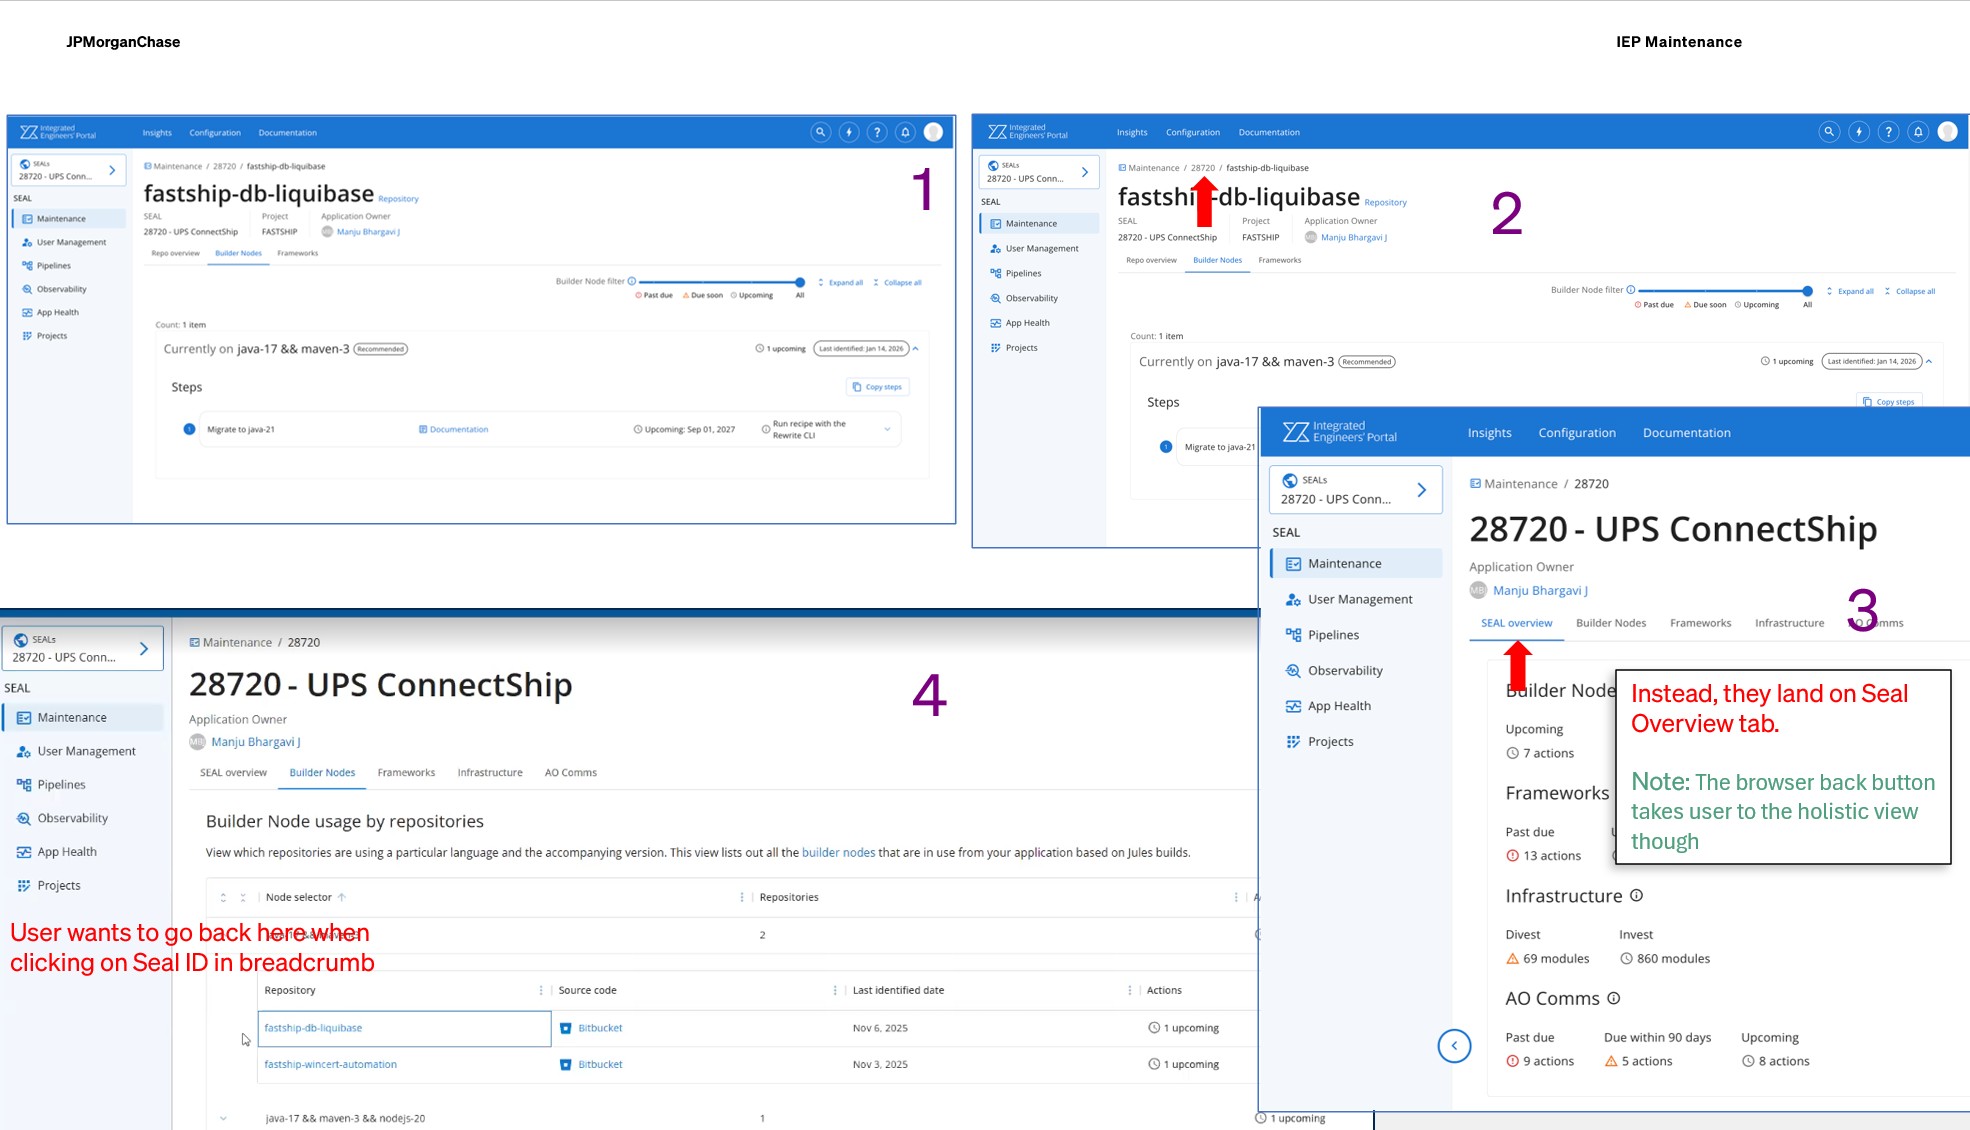
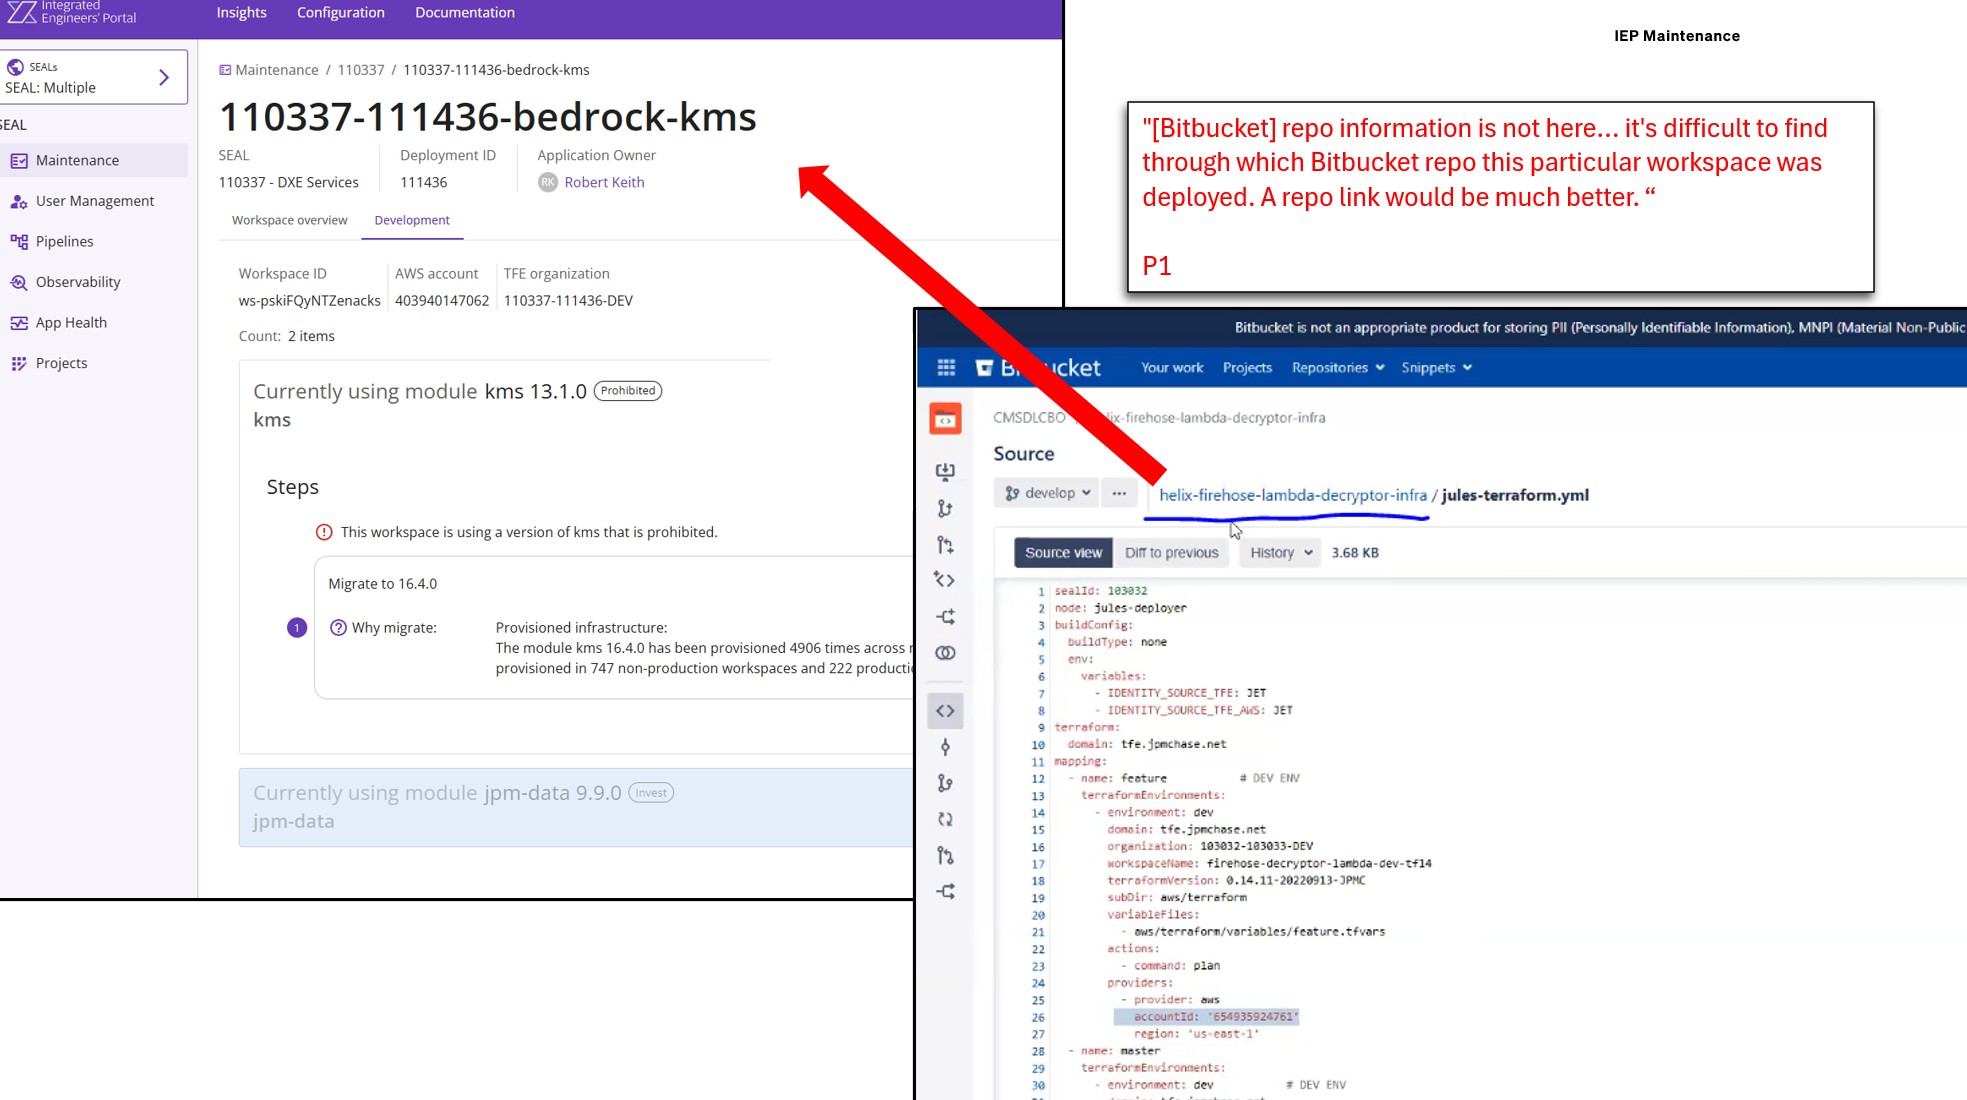
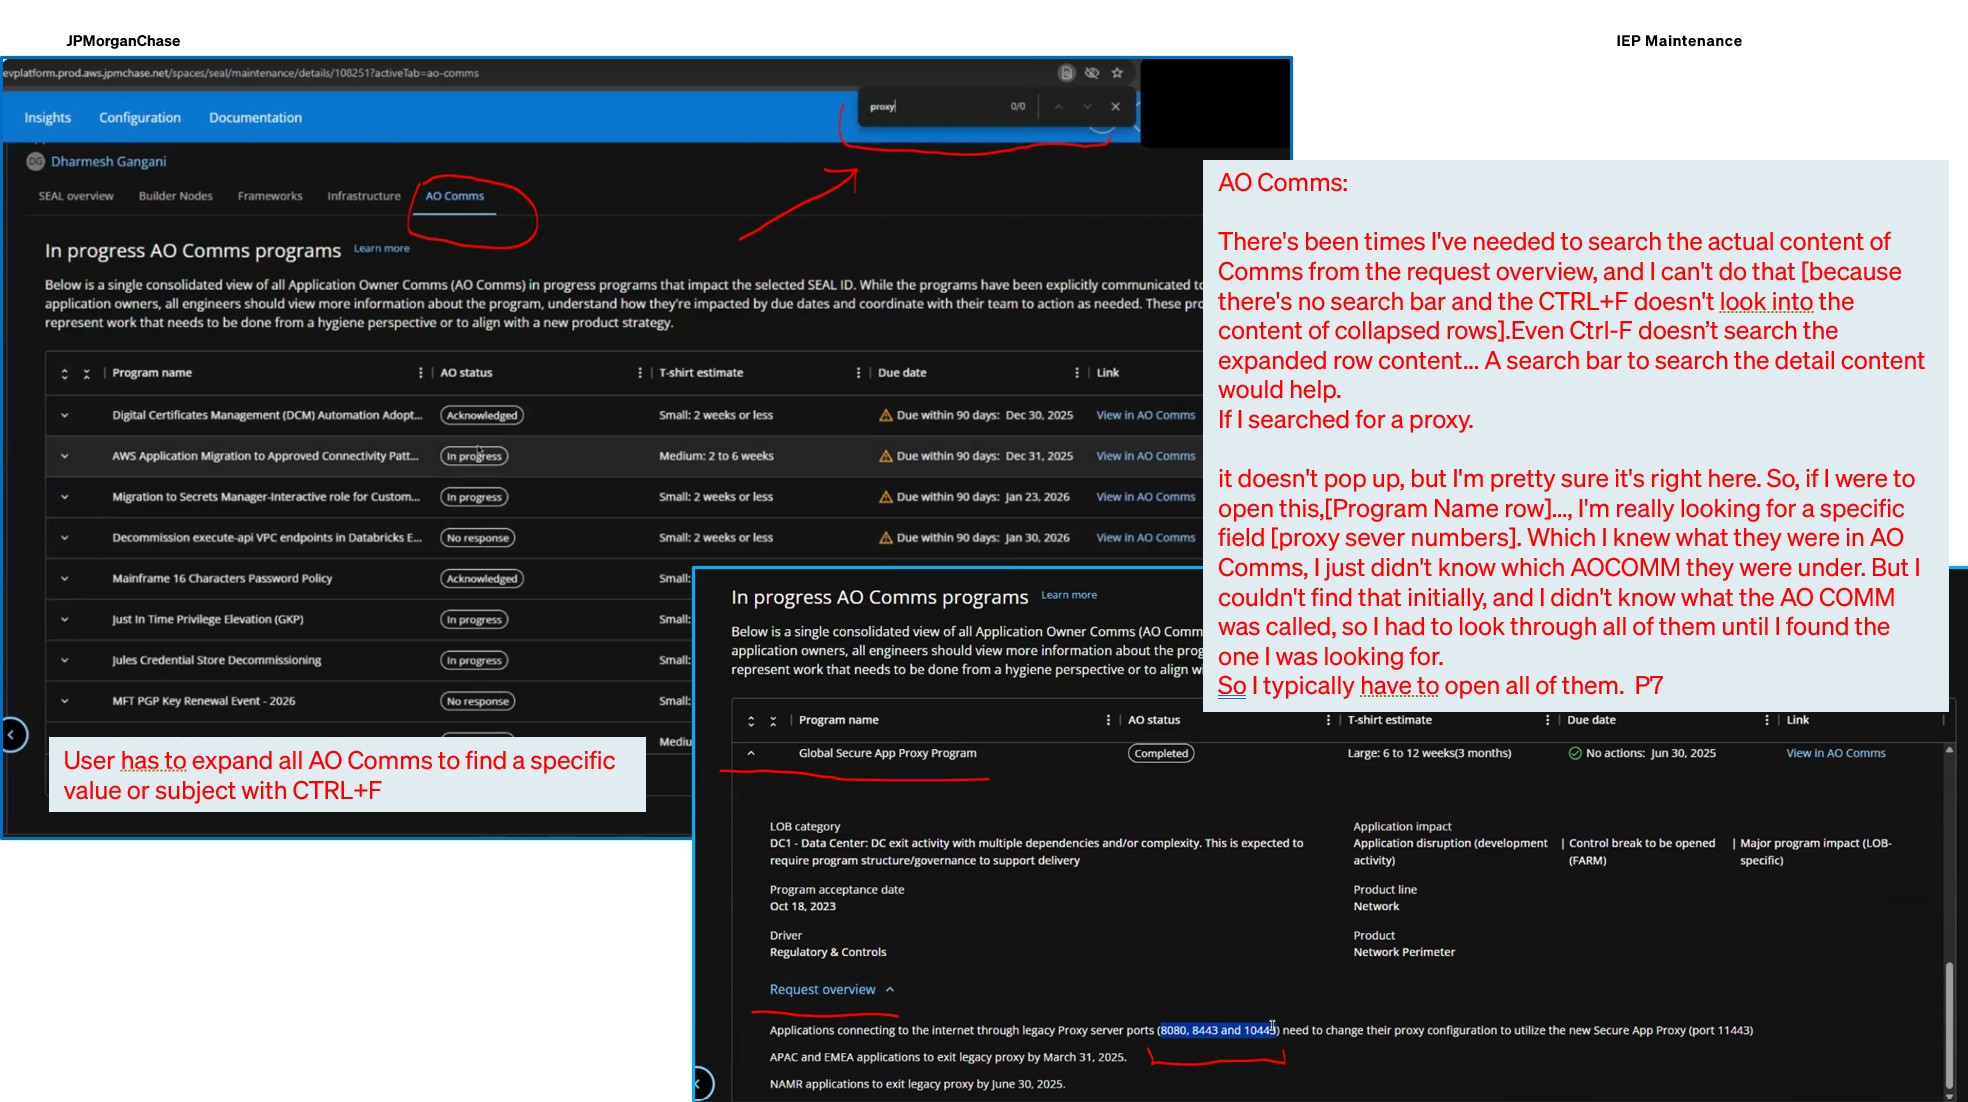
Annotated screens tracing navigation and context loss.
Annotated screens tracing navigation and context loss. View full size ↗
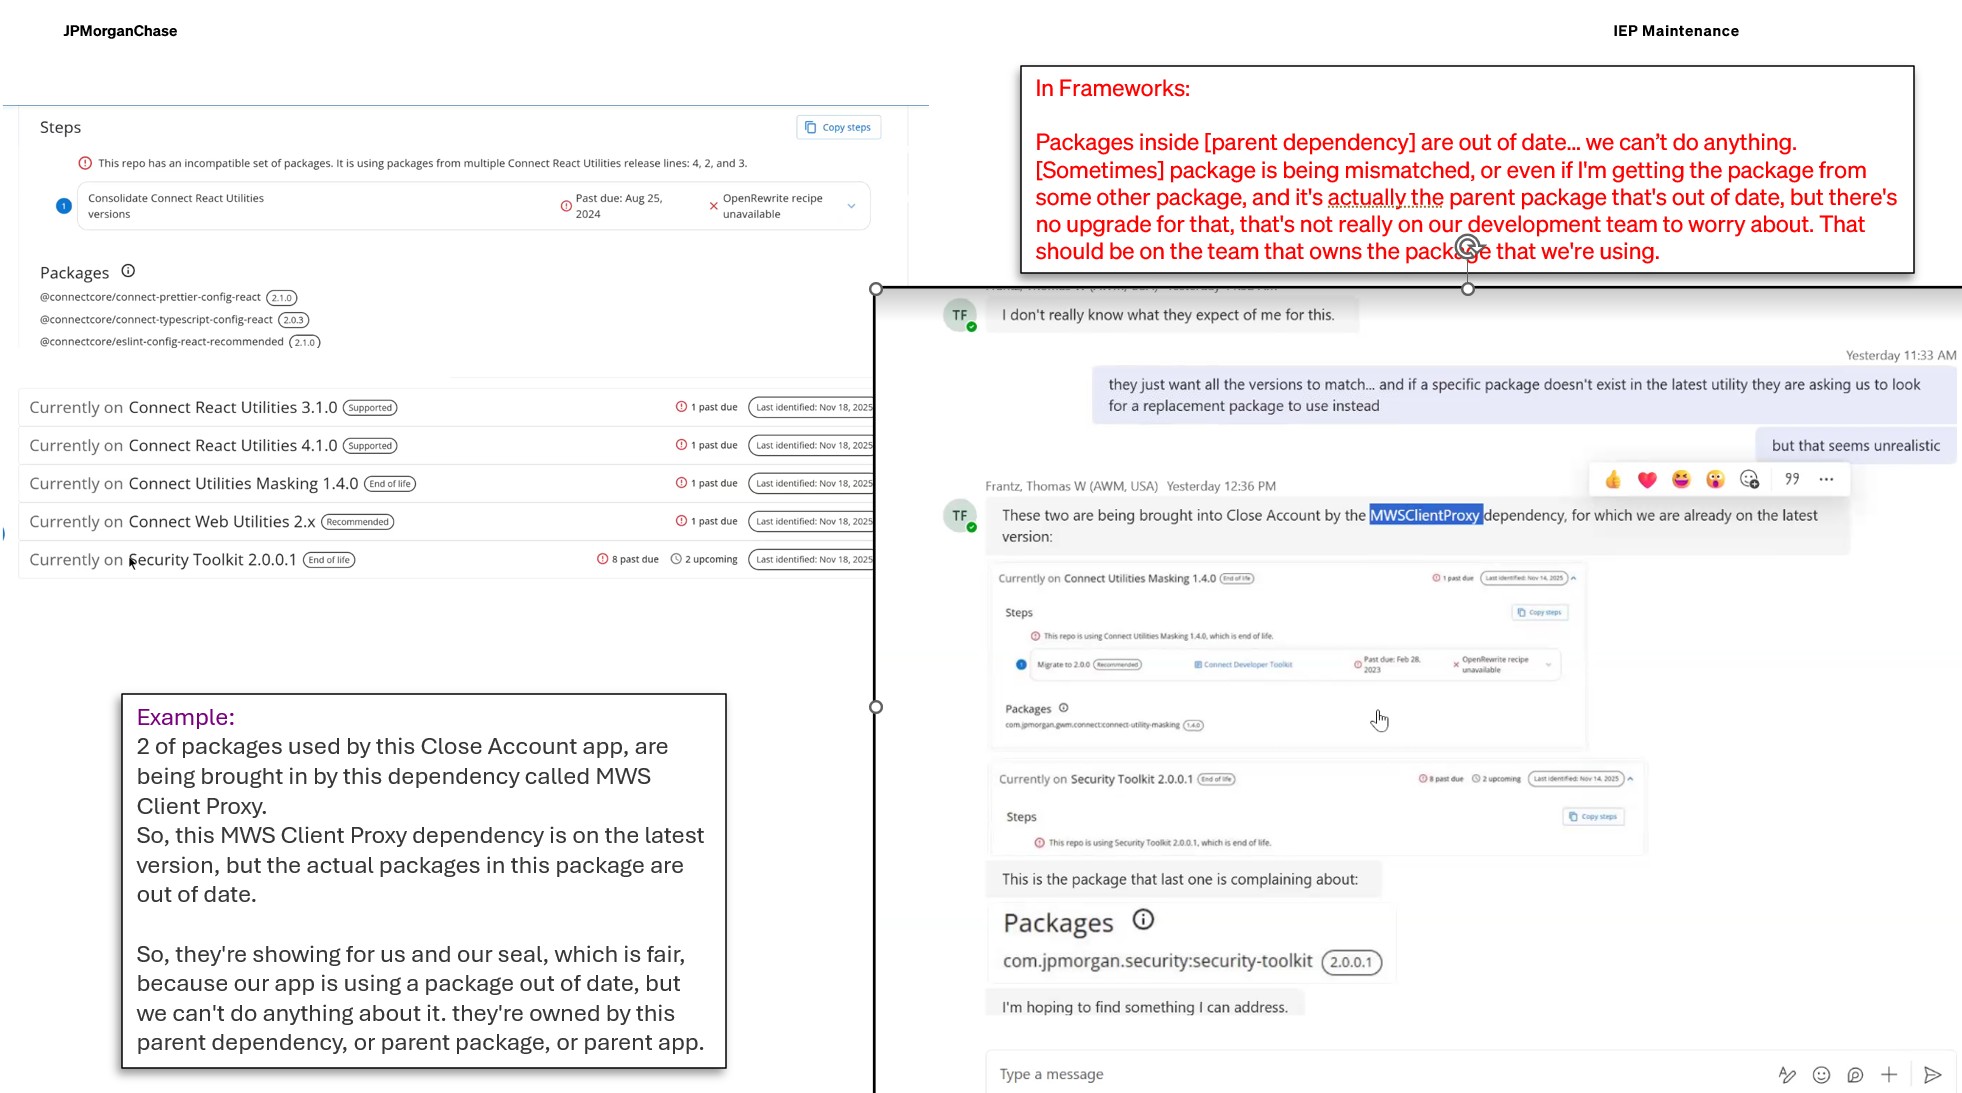
Annotated framework screens showing clarity and actionability issues.
Annotated framework screens showing clarity and actionability issues. View full size ↗
Annotated infrastructure screens connecting missing information with participant feedback.
Annotated infrastructure screens connecting missing information with participant feedback. View full size ↗
Participant feedback on locating and validating ownership information.
Participant feedback on locating and validating ownership information. View full size ↗

Reflection

A healthy overall satisfaction score can coexist with a serious task failure. Comparing the task-level and overall measures made the roadmap more specific than either measure alone.
Let’s talk through the work

Next case study

Kohl’s career experience